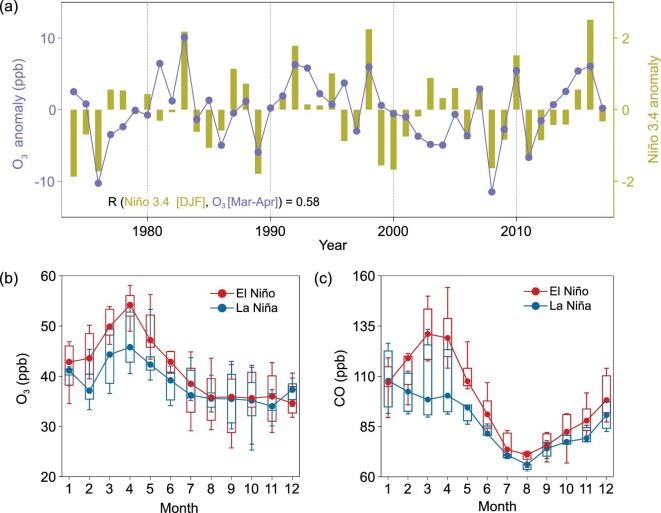
Figure 2.
Impact of ENSO on O3 and CO at Mauna Loa Observatory. (a) Springtime (March–April) O3 anomaly at MLO and Niño 3.4 anomaly of the preceding winter (December–February). Local time 0:00–8:00 data are averaged to represent the ozone level of free tropospheric air. Seasonal variations of MLO O3 (b) and CO (c) in El Niño and La Niña years (defined by the 10 highest and 10 lowest years in the Niño 3.4 index, respectively). Whiskers in (b) and (c) show the 25–75% data range and bars give the 10th and 90th percentiles.

