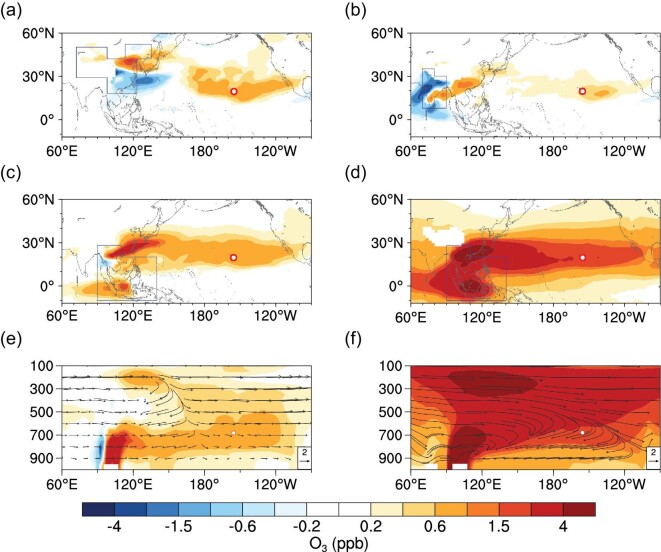
Figure 4.
Contributions of ENSO-induced O3 anomalies from main Asian emission sources in spring. Averaged O3 response to anthropogenic emissions over China (a) and India (b) in El Niño and La Niña springs (March and April) at 680 hPa. (c) Averaged O3 response to climatological BB emissions over SE Asia under ENSO circulations in El Niño and La Niña springs at 680 hPa. (d) Averaged O3 response to ENSO-induced emission intensity variability over SE in El Niño and La Niña springs at 680 hPa. (e, f) Cross-sections of O3 anomalies over 15°N–25°N, corresponding to (c) and (d). The vectors are climatological springtime winds in (f) and wind anomalies between El Niño and La Niña springs in (e). Note that the vertical components of wind are scaled 1000 times for better illustration. Source regions in (a–d) are denoted by blue polygons. Red circles mark the location of MLO.

