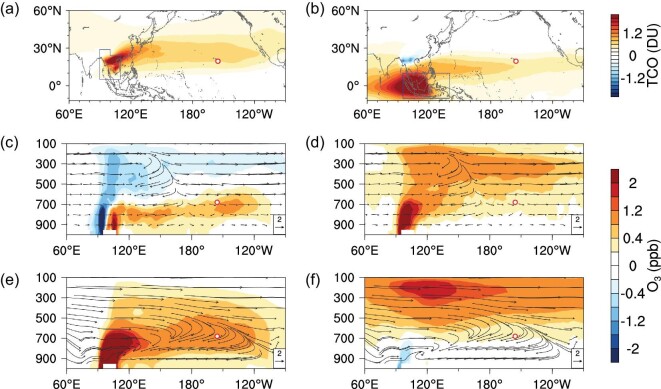
Figure 5.
Comparison of ENSO-induced O3 anomalies from biomass burning in the Indochinese Peninsula and Indonesia in spring. Averaged response of the total column O3 (TCO) below 200 hPa to averaged BB emissions from the Indochinese Peninsula (a) and Indonesia (b) in El Niño and La Niña springs. (c–e) Cross-section of O3 anomalies averaged over 15°N–25°N caused by ENSO-induced circulation differences (with climatologically averaged BB emission intensity). (d–f) Cross-section of averaged O3 anomalies by ENSO-related BB emission differences over the Indochinese Peninsula (d) and Indonesia (f). Source regions are denoted by blue polygons. Red circles mark the location of MLO. Source contributions were calculated as listed in Supplementary Table 1.

