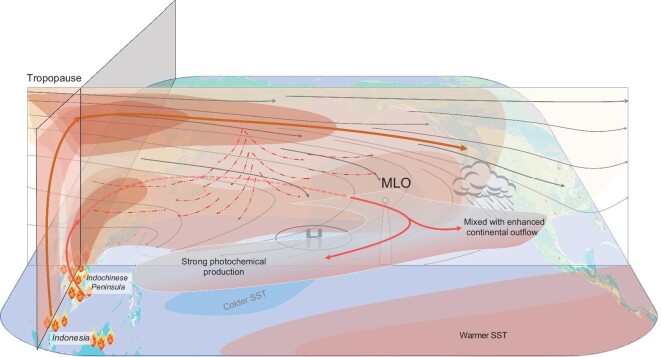
Figure 6.
Conceptual schematic of the trans-Pacific O3 enhancement induced by ENSO and ENSO-mediated vegetation fires in Southeast Asia in spring. The vertical cross-section shows the O3 plumes and wind flows (gray lines for climatological average and red dashed ones for the anomaly in El Niño spring). Red and brown bold lines show the main transport pathways of biomass burning plumes from the Indochinese Peninsula, and Indonesia, respectively. The red dashed lines present the ENSO-induced wind anomalies along the cross-section. Blue and pink areas over the Pacific indicate the SST anomaly between the El Niño and La Niña years.

