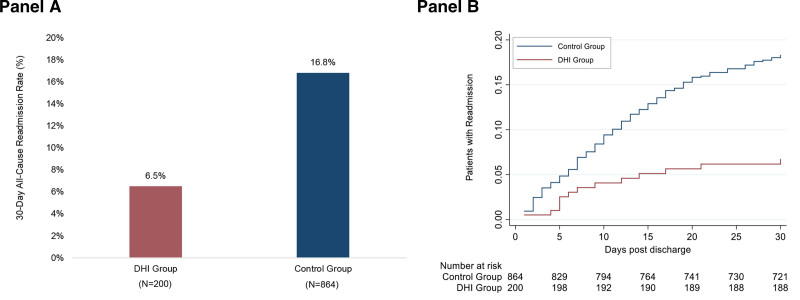
Figure 4.
Thirty-day all-cause readmission by intervention status. A, Shows 30-day all-cause readmission rates for the digital health intervention (DHI) group and the historical control group. B, Shows Nelson-Aalen estimates of the cumulative proportion of patients with 30-day readmission post-discharge. The numbers below the graph are the numbers of patients at risk in each study group at 5, 10, 15, 20, 25, and 30 days, when the last observed readmission event occurred.

