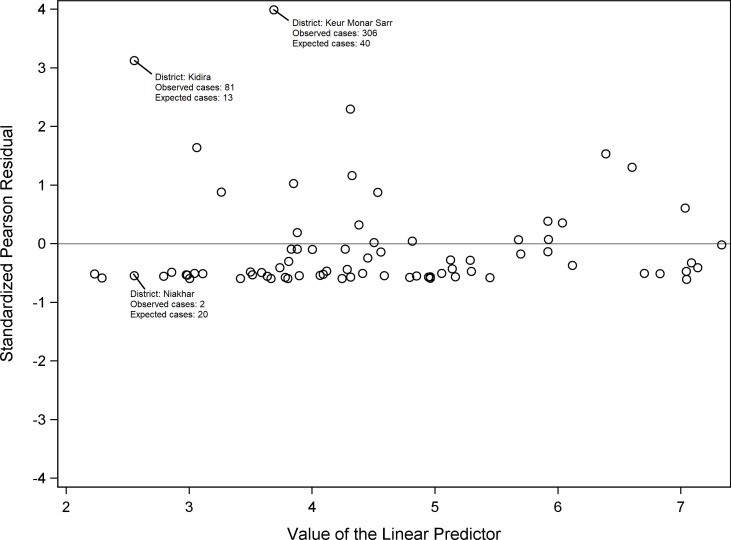
Figure 1.
Multivariable Poisson regression at the district level and residual dependence plot (n=79). Outcome: number of confirmed COVID-19 cases at the healthcare district level (data accessed on 26 November 2020: http://www.sante.gouv.sn/Pr%2525C3%2525A9sentation/coronavirus-informations-officielles-et-quotidiennes-du-msas). Offset: total population of the healthcare district. Covariates: urbanisation rates (%), poverty index (%) and rates of people aged 50 and older (%).

