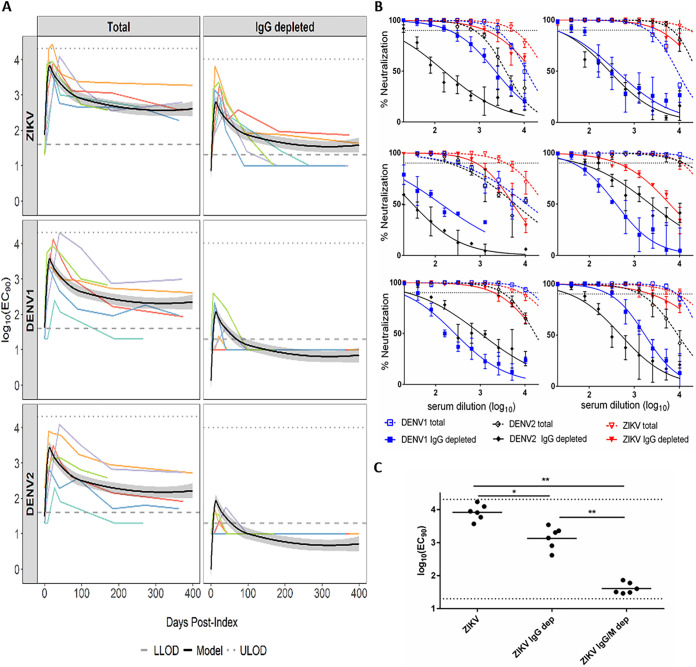
FIG 1.
Individuals with highly ZIKV-specific neutralizing IgM. (A) NAbs of longitudinal plasma samples from 6 individuals in group 1. Lower limits of detection (LLOD) of IgG-depleted NAb (1.3 log10) and total NAb (1.6 log10) of the assay are represented by dashed lines. Upper limits of detection (ULOD) of IgG-depleted NAb (4.01 log10) and total NAb (4.31 log10) are represented by dotted lines. Bold black line represents estimated average NAb kinetic curves from the spline model with 95% confidence bounds (shaded regions). Colored lines represent longitudinal NAb titers of each individual. (B) Neutralization curves for 6 individual plasma samples at the time point with peak ZIKV NAb. Dotted line represents 90% neutralization (EC90). (C) Samples from the assay whose results are shown in panel B were further depleted of IgM (IgG/M dep) before R-mFRNT for comparison of the geometric mean NAb titers among total, IgG-depleted, and IgG/M-depleted outcomes. LLOD (1.3 log10) and ULOD (4.31 log10) are represented by dotted lines. Significance was measured by two-tailed paired t test (*, P < 0.05; **, P < 0.0001).

