Figure 6.

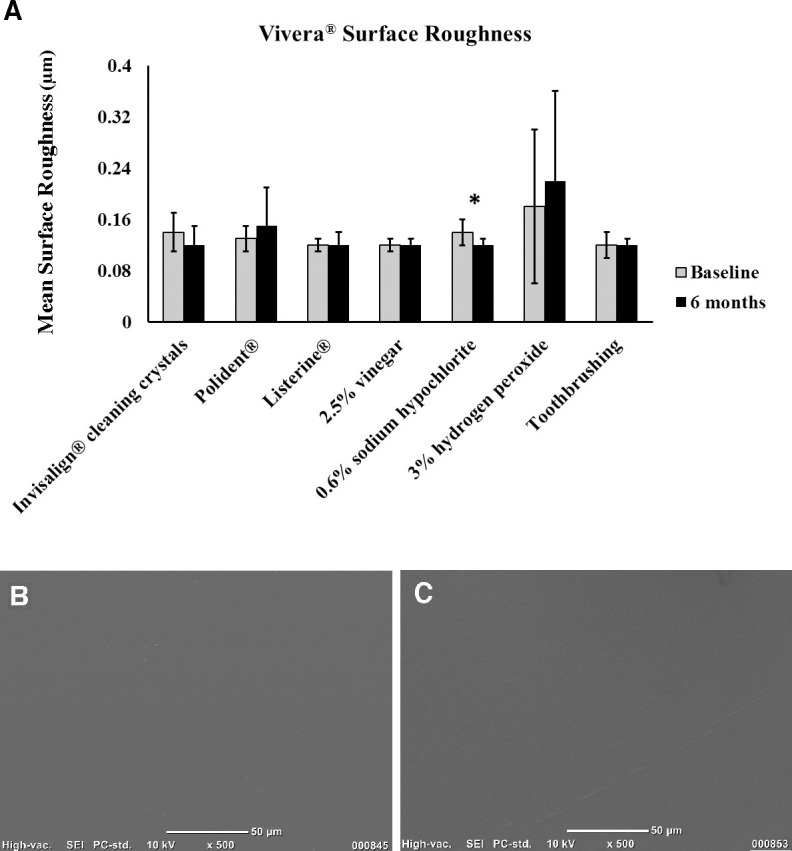
(A) Bar graph of polyurethane surface roughness between baseline and 6 months (* P < .05). (B, C) Scanning electron microscope images of polyurethane specimens from the sodium hypochlorite group at (B) baseline and (C) 6 months.

(A) Bar graph of polyurethane surface roughness between baseline and 6 months (* P < .05). (B, C) Scanning electron microscope images of polyurethane specimens from the sodium hypochlorite group at (B) baseline and (C) 6 months.