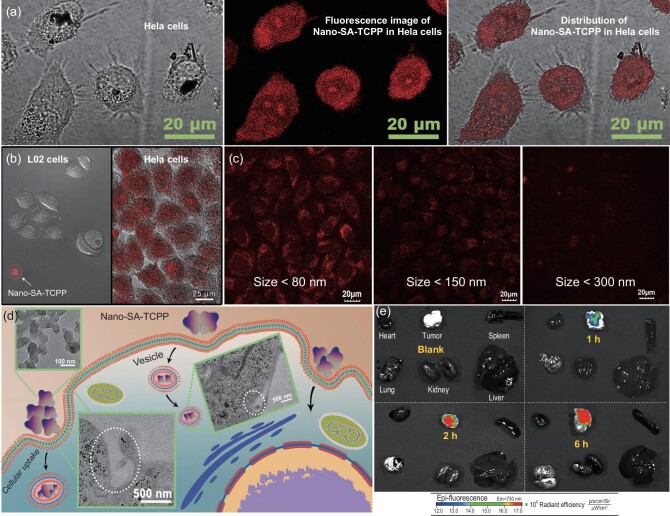
Figure 3.
The cellular uptake and targeted property of Nano-SA-TCPP. (a) The Nano-SA-TCPP distribution in Hela cells observed by fluorescence image. (b) The comparison of cellular uptake behavior between normal cells (L02) and Hela cells by the fluorescence image of Nano-SA-TCPP. (c) The cellular uptake behavior of Nano-SA-TCPP with different particle sizes. (d) The cellular uptake process of Nano-SA-TCPP, where the inserted images are the TEM images of Nano-SA-TCPP and cells in the uptake process. (e) The Nano-SA-TCPP distribution in major organs and the tumor.

