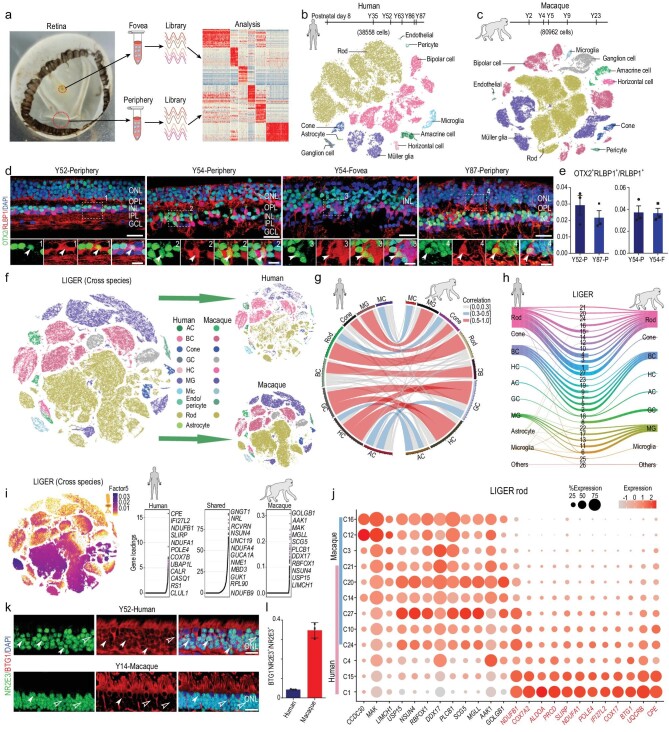
Figure 1.
Cross-species transcriptome comparison of single-cell transcriptome profiles between human and macaque retina. (a) Experimental workflow for single-cell RNA-seq of human and macaque retina. Retinae were separated into foveal and peripheral samples for single-cell RNA-seq analysis. (b and c) t-SNE plot of single cells from human (b) and macaque (c) retina labelled with cell types. We obtained 38,558 human cells (samples: D8, Y35, Y52, Y63, Y86 and Y87) and 80,962 macaque cells (samples: Y2, Y4, Y5, Y9 and Y23). (d) Staining of OTX2 and RLBP1 of adult human retina in different age and region. Green: OTX2, red: RLBP1, blue: DAPI; bottom panel is higher-magnification view of top region boxed; solid arrowheads indicate double positive cell. Scale bars: 25 μm (top) and 10 μm (bottom). Experiments were repeated three times independently with similar results. (e) Bar charts showing proportion of OTX2+RLBP1+ cells out of RLBP1+ cells in human adult Y52 peripheral, Y87 peripheral, Y54 peripheral and Y54 foveal retina, related to Fig. 1d. Data are means ± s.e.m.. Each sample was counted from three different slices. (f) t-SNE visualization of 119,520 single cells analyzed by LIGER, color-coded by cell type. Top right is human and bottom right is macaque, with each dot representing a single cell (AC: amacrine cell, BC: bipolar cell, GC: ganglion cell, HC: horizontal cell, MG: Müller glia, Mic: microglia, Endo: endothelial). (g) Circos plot showing cross-species mapping between retinal cell types from humans and macaques. Correlation coefficients are expressed by width and color. Gray indicates correlation coefficient below 0.3, blue indicates correlation coefficient between 0.3 and 0.5, and red represents value greater than 0.5. (h) River plots comparing cell-type assignments for humans and macaques with LIGER joint clusters. (i) Cell factor loading values (left) and gene loading plots (right) of left loading dataset-specific and shared genes for factor 5. (j) Dot plot for specific genes related to factor 5 and differentially expressed genes (DEGs) of human and macaque rods in LIGER joint clusters, defined as rods. Macaque-specific genes are in black; human-specific genes are in red. Color of each dot shows average scale expression, and its size represents percentage of cells in cluster. (k) Immunostaining of NR2E3 and BTG1 in adult human and macaque retina. Solid arrowheads indicate BTG1+NR2E3+ cells, empty arrowheads indicate BTG1− NR2E3+ cells. Scale bar: 15 μm. (l) Quantification of the proportion of BTG1−NR2E3+ cells in adult human and macaque retina related to Fig. 1k. Each sample was counted from three different slices. Data are means ± s.e.m..

