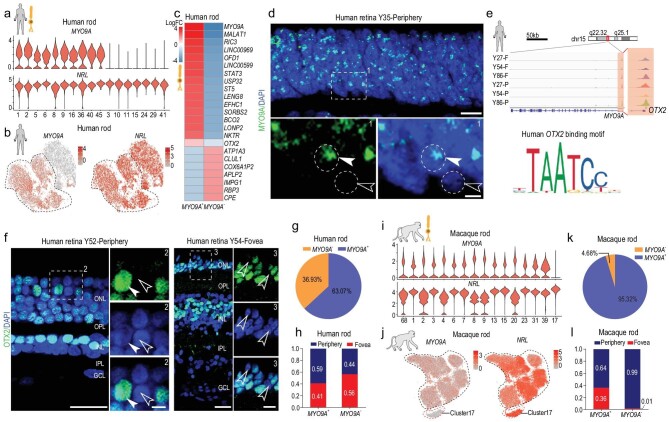
Figure 2.
Distinct subtypes and differences in rods among primates. (a) Violin plots depicting expression of marker genes MYO9A and NRL, distinguishing 17 rod subclasses in human adult retina. (b) Visualization of expression of known marker genes MYO9A and NRL by t-SNE in human adult retina. Cells are colored according to gene expression levels (red, high; gray, low). (c) Heatmap illustrating log2 fold changes of differentially expressed genes (DEGs) between MY09A+ and MYO9A− rod subclasses in human adult retina. (d) In situ RNA hybridization of MYO9A in adult human retina. Arrowheads and dotted circles show positive and negative cells, respectively; solid arrowhead indicates positive cell, and empty arrowhead indicates negative cell. Blue, DAPI (nucleus marker). Scale bars: 10 μm (top) and 5 μm (bottom). Experiments were repeated three times independently with similar results. (e) Normalized ATAC-seq profiles of MYO9A in fovea and periphery of Y27, Y54 and Y86 retina samples showing activation of MYO9A. Amplifying panel shows predicted OTX2 binding sites (top). DNA binding motif of OTX2 (bottom), identified in ATAC-seq peaks close to MYO9A transcription start site (TTS). (f) Immunostaining of OTX2 in adult human peripheral (left) and foveal retina (right). Solid arrowheads indicate positive cells; empty arrowheads indicate negative cells. Scale bars: 25 μm (left) and 5 μm (right). Experiments were repeated three times independently with similar results. (g) Pie chart showing distribution of MYO9A+ and MYO9A− subclasses in human adult retina samples. (h) Bar chart showing regional distributions of MYO9A+ and MYO9A− rod subclasses in human retina samples. (i) Violin plots depicting expression of marker genes MYO9A and NRL, distinguishing 16 rod subclasses in macaque adult retina. (j) Visualization of expression of MYO9A and NRL by t-SNE in macaque retinae. Cells are colored according to gene expression levels (red, high; gray, low). (k) Pie chart showing distribution of MYO9A+ and MYO9A− subclasses in macaque adult retina samples. (l) Bar chart showing regional distributions of MYO9A+ and MYO9A− rod subclasses in macaque retina samples.

