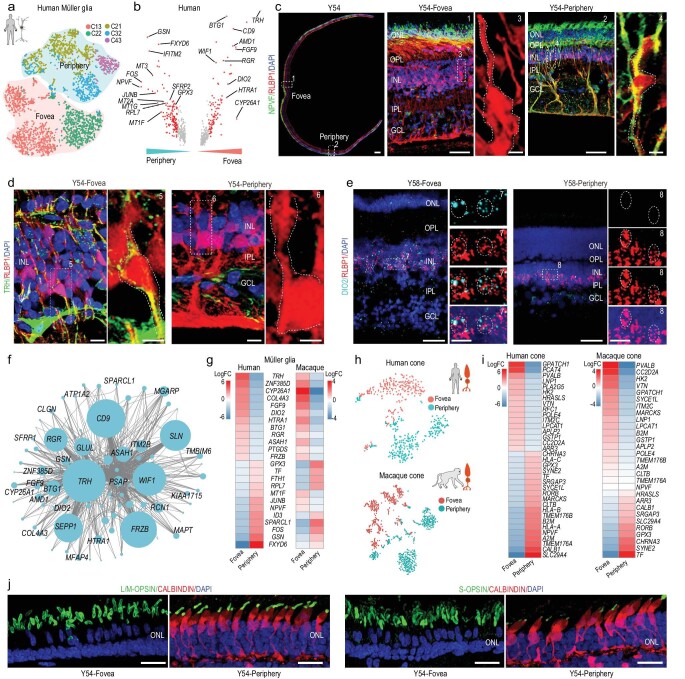
Figure 3.
Regionally different transcriptomes of primate MG and cones. (a) t-SNE plot of MG distinguished by different subclasses (dots, individual cells; color, subclasses; color contours, regions). (b) Volcano plot of DEGs between human foveal and peripheral MG. Red dots show average log2 fold changes >0.5. (c) Immunostaining of RLBP1 and NPVF in Y54. Middle panel is higher magnification view of fovea in left-most panel; right panel is higher-magnification view of periphery in left-most panel. Scale bar of Y54: 300 μm, 50 μm (middle), 5 μm (middle on right), 50 μm (right), 5 μm (right-most). Experiments were repeated three times independently with similar results. (d) Immunostaining of RLBP1 and TRH in Y54 human retina, Scale bars: 10 μm (left) and 5 μm (right). Experiments were repeated three times independently with similar results. (e) In situ RNA hybridization of DIO2 and RLBP1 in Y58 human retina. Blue, DAPI (nucleus marker). Scale bars: 50 μm (left) and 10 μm (right). Experiments were repeated three times independently with similar results. (f) Network analysis of blue module genes. (g) Heatmap illustrating log2 fold changes of DEGs related to human foveal and peripheral Müller glia in human and macaque adult retina. (h) t-SNE plot of human (top) and macaque (bottom) cones based on regions (dots, single cell; color, regions). (i) Heatmap showing log2 fold changes in DEGs between foveal and peripheral cones in human (left) and macaque (right) adult retina. (j) Immunostaining of S-OPSIN/CALBINDIN and L/M-OPSIN/CALBINDIN in Y54. Scale bar: 25 μm. Experiments were repeated three times independently with similar results.

