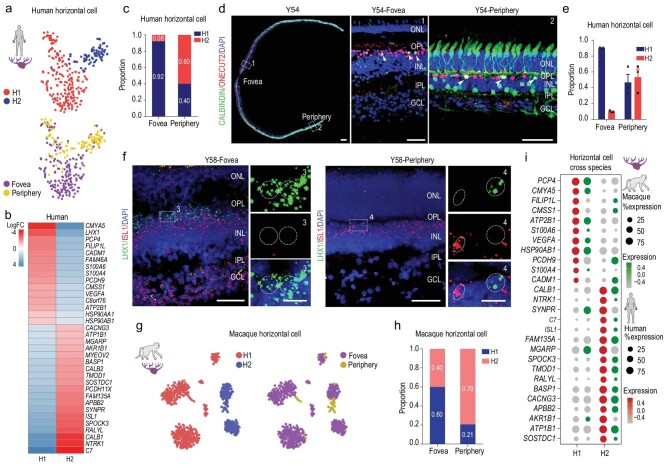
Figure 4.
Molecular properties of retinal horizontal cells in primates. (a) t-SNE plot of human horizontal cells, colored by subclass (top) and region (bottom). Each dot is a single cell. (b) Heatmap showing log2 fold changes in DEGs between H1 and H2 horizontal cells in human adult retina. (c) Proportion of human horizontal cell subclasses in foveal and peripheral regions. (d) Immunostaining of CALBINDIN and ONECUT2 in Y54. Middle panel is higher-magnification view of fovea in left-most panel; right panel is higher-magnification view of periphery in left-most panel. Solid arrowheads indicate double positive cell. Scale bars of Y54: 300 μm, 50 μm (middle) and 50 μm (right). Experiments were repeated three times independently with similar results. (e) Quantification of proportion of H1 and H2 subclasses in foveal and peripheral human adult retina related to Fig. 4d. Each sample was counted from three different slices. Data are means ± s.e.m.. (f) In situ RNA hybridization of LHX1 and ISL1 in Y58 human retina. Blue, DAPI (nucleus marker). Scale bars: 50 μm (left) and 10 μm (right). Experiments were repeated three times independently with similar results. (g) t-SNE visualization of macaque horizontal cells, color-coded by subclass (left) and region (right). Each dot represents a single cell. (h) Proportion of macaque horizontal cell subclasses in foveal and peripheral regions. (i) Dot plot showing H1- and H2-specific marker genes in human (red) and macaque (green) adult retina. Size of each dot represents percentage of cells in each cluster (red/green, high expression; gray, low expression).

