Figure 6.
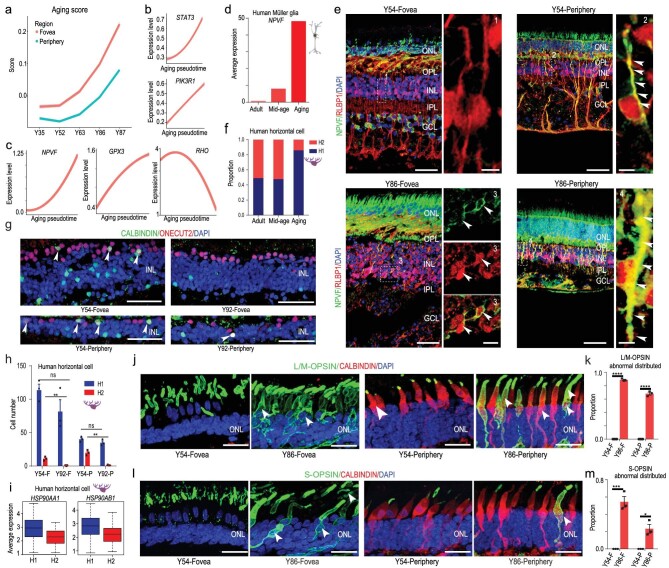
Region- and cell-type-specific molecular changes in aged human retina. (a) Pseudo-aging trajectories between fovea and periphery in human retina. The shadow represents the confidence interval (95%) around the fitted curve. (b) Trajectories of expression of classical human aging genes across human adult retina aging pseudotime. The shadow represents the confidence interval (95%) around the fitted curve. (c) Trajectories of expression of up- and down-regulated genes across human adult retina aging pseudotime. The shadow represents the confidence interval (95%) around the fitted curve. (d) Average expression of NPVF at different aging stages in Müller glia. (e) Immunostaining of RLBP1 and NPVF in Y54 and Y86. Solid arrowheads indicate double positive cell. Scale bars of Y54: 50 μm (left), 5 μm (right). Scale bars of Y86: 50 μm (left), 10 μm (right, fovea), 5 μm (right periphery). Experiments were repeated three times independently with similar results. (f) Cell proportions of human H1 and H2 subclasses at different aging stages. (g) Confocal images of adult human retina in Y52 and Y92. Green: CALBINDIN, red: ONECUT2, blue: DAPI. Solid arrowheads indicate double positive cell. Scale bar: 50 μm. Experiments were repeated three times independently with similar results. (h) Bar chart showing quantification of CALBINDIN/ONECUT2 immunostaining data, related to Fig. 6g. Data are means ± s.e.m.. P values calculated by two-sided t-test. n.s., no significance, **P < 0.01. Each sample was counted from three different slices. (i) Boxplot for HSP90AA1 and HSP90AB1 in H1 and H2 subclasses. (j) Immunostaining of L/M-OPSIN/CALBINDIN in Y54 and Y86. Solid arrowheads indicate OPSIN translocation in soma. Scale bar: 25 μm. Experiments were repeated three times independently with similar results. (k) Bar chart showing quantification of Fig. 6j (data are means ± s.e.m., Y54-F VS Y86-F, ****P < 0.0001; Y54-P VS Y86-P, ****P < 0.0001). Each sample was counted from three different slices. (l) Immunostaining of S-OPSIN/CABINDIN in Y54 and Y86. Solid arrowheads indicate OPSIN translocation in soma. Scale bar: 25 μm. Experiments were repeated three times independently with similar results. (m) Bar chart showing quantification of Fig. 6l. Data are means ± s.e.m.. P values calculated by two-sided t-test. *P < 0.05, ***P < 0.001. Each sample was counted from three different slices.

