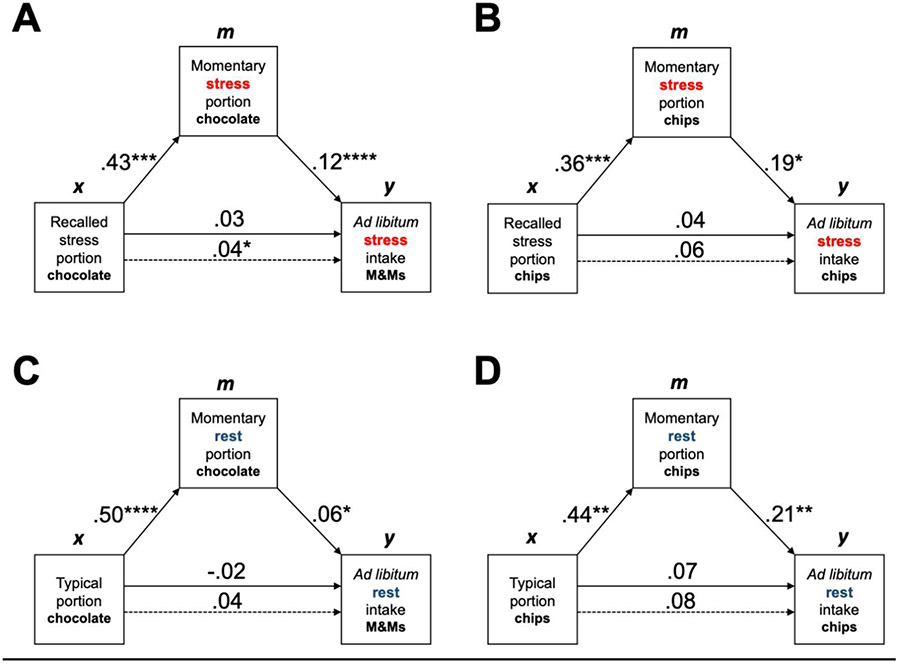
Figure 6. Mediation models.
Four mediation analyses were conducted. x is an independent variable (recalled stress portion size in diagrams A & B, top row, and typical portion size in diagrams C & D, bottom row). y is a dependent variable (ad libitum stress intake in diagrams A & B and ad libitum rest intake in diagrams C & D). m is the proposed mediating variable (momentary stress portions in diagrams A & B and momentary rest portions in diagrams C & D). Diagrams A & C (left column) are mediation analyses done for milk chocolate (x and m) and M&Ms (y), while diagrams B & D (right column) are for potato chips (x, m, and y). In diagrams A-D, the coefficients on the solid arrows are unstandardized and the coefficients on dashed arrows are standardized (β). The solid arrow between x and y represents the direct effect of x on y, while the dashed arrow represents the indirect effect of x on y as the path of x to y through m. Both of these effects comprise the total effect of x on y.
* P ≤ 0.05
** P ≤ 0.01
*** P ≤ 0.005
**** P ≤ 0.001

