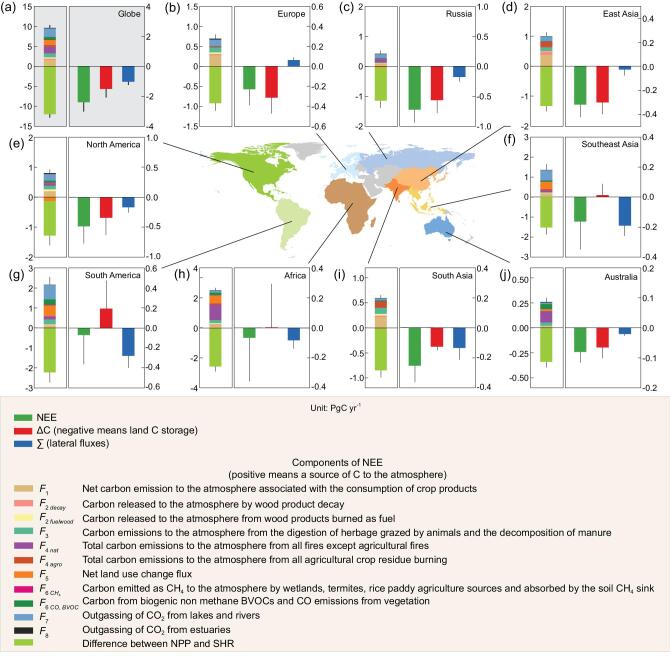
Figure 1.
(a-j) Carbon-storage change from inventories (ΔC in red) and lateral fluxes from trade- and riverine-carbon export to the ocean for different regions of the globe (in blue) for the 2000s (Supplementary Fig. 1). The resulting bottom-up NEE from the sum of ΔC and lateral fluxes is given in green. An atmospheric convention is used, so that ΔC < 0 denotes an increase in land-carbon stocks and NEE < 0 is also a net uptake of atmospheric CO2. The upper stacked bars on the left show the NEE subcomponents that are sources of C to the atmosphere, excluding soil heterotrophic respiration, and the green bar is the resulting imbalance between the net primary productivity (NPP) and soil heterotrophic respiration, a negative value indicating that the soil heterotrophic respiration is smaller than NPP.

