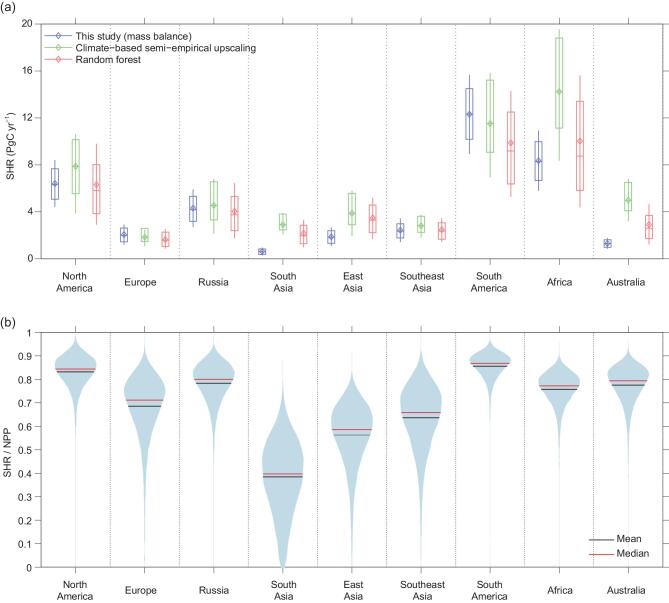
Figure 2.
(a) Regional estimates of soil heterotrophic respiration from this study in blue and from two other estimates obtained using an independent approach from upscaling a global data set of site-level field measurements [38] by reference [31]. The whisker bars indicate the interquartile range and the full range. (b) Regional estimates of the ratio between soil heterotrophic respiration and NPP for each region with mean and median values of distributions calculated using a Monte-Carlo analysis (see ‘Methods’ section).

