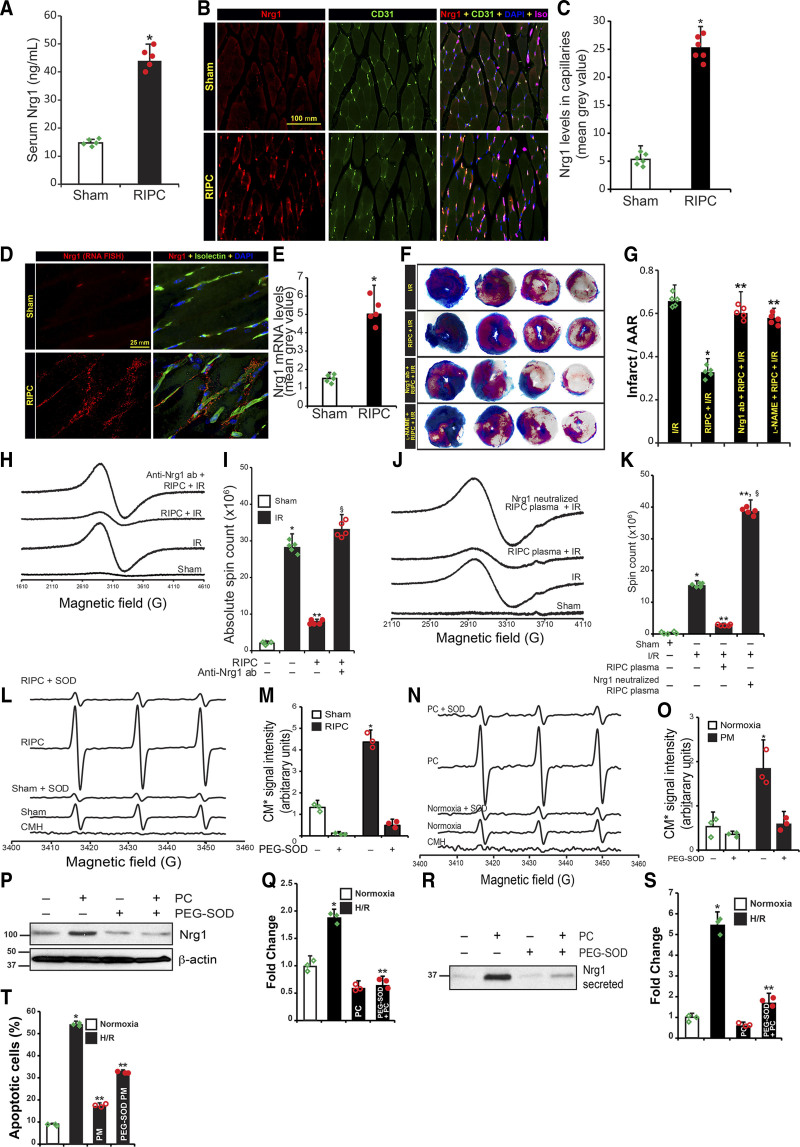
Figure 1.
Superoxide-induced Nrg1 (neuregulin 1) release by the microvascular endothelial bed of the hindlimb acts as remote ischemic preconditioning (RIPC)-factor and protects the myocardium from ischemia/reperfusion (I/R)-induced injury. A, Mice were either subjected to sham or three cycles of 5 min hindlimb ischemia followed by 5 min reperfusion. Thirty minutes after the last I/R cycle, serum Nrg1 levels were determined by ELISA. Mean±SEM was plotted as a bar graph (n=5). *P<0.01 vs sham. B, Formaldehyde fixed paraffine embedded gastrocnemius muscle sections from sham or RIPC-treated mice were immunostained with anti-Nrg1 and anti-CD31 antibodies along with isolectin GS-IB4, scale bar=100 mm. C, Nrg1 specific fluorescent signals were quantitated, and mean±SEM fluorescent values were plotted as a bar graph (n=6). *P<0.01 vs sham (Student t test). D, To confirm the source of Nrg1, gastrocnemius muscle sections were hybridized with mouse Nrg1 Stellaris fluorescent in situ hybridization (FISH) Probe set labeled with CAL Fluor Red 590 Dye. Capillaries in the sections were stained with isolectin GS-IB4 conjugated with Alexa Fluor 488. Scale bar=25 mm. E, Mean fluorescence values from RNA FISH was quantitated, and mean±SD plotted as a bar graph (n=5). *P<0.01 vs sham. F, Mice were treated with control IgG or with neutralizing Nrg1 antibodies or l-NAME subjected to either I/R surgery or RIPC followed by I/R surgery, and TTC staining was performed. G, Infarct area in relation to area at risk (AAR) was calculated, and mean±SD plotted as a bar graph (n=5). *P<0.01 vs I/R, **P<0.01 vs RIPC+I/R (ANOVA). H, Mice were subjected to sham or myocardial I/R or RIPC followed by I/R surgery and perfused with annexin-V-Fe complex as described in Methods. The infarcted tissue was excised, and tissue bound annexin-V was quantified by measuring annexin-V conjugated paramagnetic iron by electron spin resonance (EPR). To block the function of circulating Nrg1 in mice, neutralizing anti-Nrg1 antibodies (150 µg/kg) or control IgG was administered to mice before RIPC and then subjected to RIPC+IR injury. I, Absolute spin count was calculated from EPR spectra, and means±SD (n=5) was plotted as a bar graph. *P<0.01 vs sham, **P<0.01 vs IR, §P<0.01 vs RIPC+IR, (ANOVA). J, Plasma from RIPC-subjected mice were prepared. Sibling mice were administered with RIPC, or Nrg-1 neutralized RIPC-plasma and then subjected to IR. Tissue apoptosis was measured as in H. K, Tissue bound annexin-V was quantified, and mean±SD was plotted as a bar graph (n=5). *P<0.01 vs sham, **P<0.01 vs IR, §P<0.01 vs RIPC+IR (ANOVA). L, Superoxide formation was quantitated in gastrocnemius tissue from sham or RIPC-exposed mice. Superoxide formation isolated was determined by EPR using 1-hydroxy-3-methoxycarbonyl-2,2,5,5-tetramethylpyrrolidine hydrochloride (CMH). M, CM* EPR signals were quantitated by Spin Count using Xenon nano 1.2 software and plotted as a bar graph (n=3). *P<0.01 vs sham (ANOVA). N, HMVECs were exposed to hypoxia for 2 h, followed by reoxygenation for 1 h (PC, preconditioning), and superoxide formation in HCAECs was determined by EPR using CMH. O, CM* EPR signals were quantitated and plotted as a bar graph (n=3). *P<0.01 vs normoxia (ANOVA). L–O, PEG-SOD (polyethylene glycol-superoxide dismutase) was added to determine the superoxide-specific EPR signal. P, HMVECs (n=3) were incubated with or without PEG-SOD for 6 h and subjected to PC. Cell lysates were analyzed for full-length Nrg1; (Q) Densitometry of Figure 1P, *P<0.05 vs untreated, **P<0.01 vs PC. R, Detection of Nrg1in culture medium from control or PC-subjected cells. Medium was analyzed for the full length and secreted Nrg1, respectively, by Western blotting, *P<0.01 vs HR, **P<0.01 vs PEG-SOD. T, HCAECs were incubated with preconditioned medium (PM) obtained from control or PEG-SOD treated HMVECs. Then they were exposed to hypoxia/reoxygenation (H/R). Cells undergoing apoptosis were labeled with annexin V-FITC conjugate, and the percentage of apoptotic cells was quantitated by fluorescence-activated cell sorting analysis using Attune NxT Flow Cytometer and plotted as a bar graph (n=3). *P<0.01 vs normoxia, **P<0.01 vs PM+H/R (ANOVA, Tukey post test).

