
Figure 1:
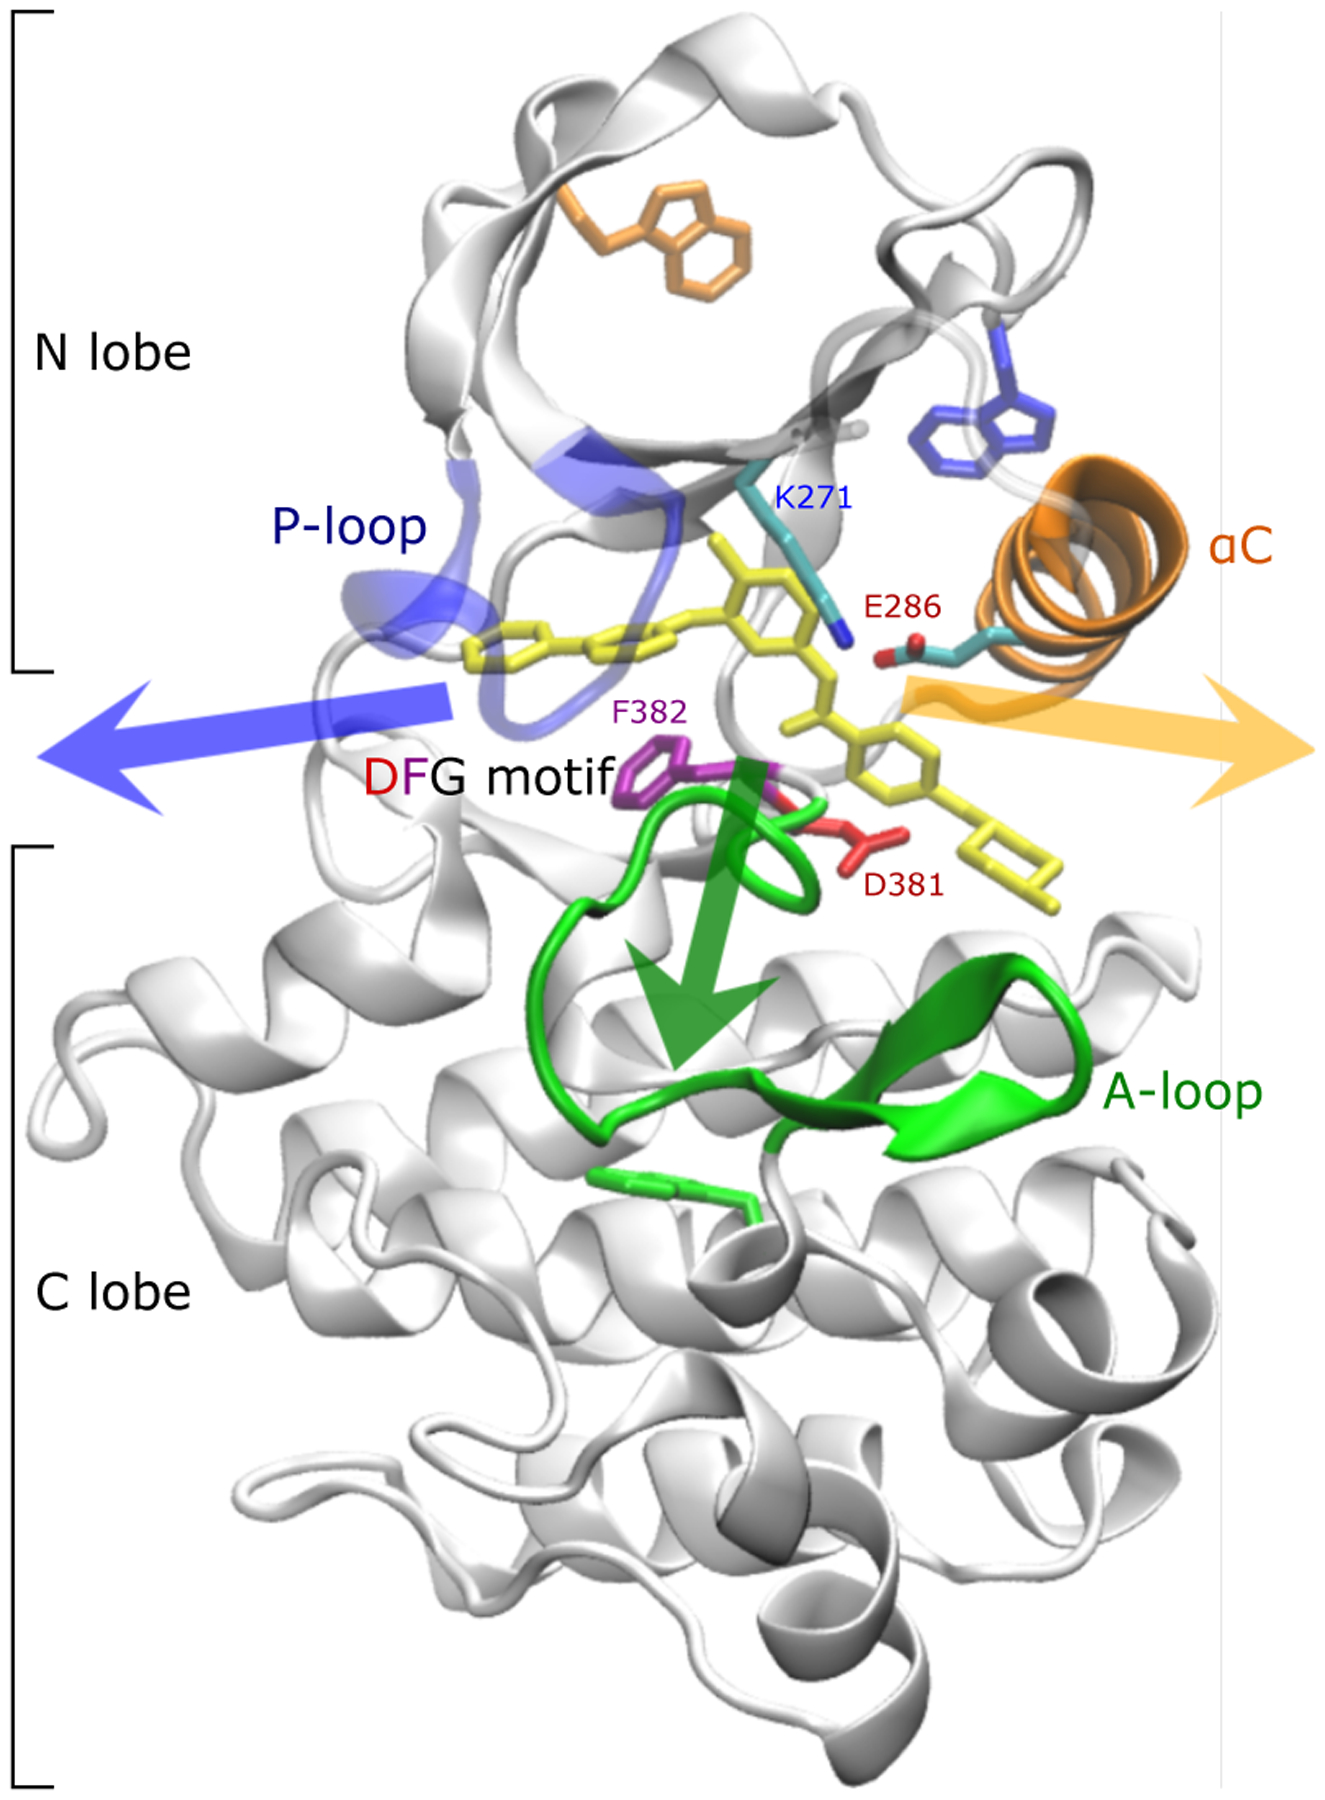
Crystallographic binding mode: imatinib (yellow) bound to the catalytic domain of Abl kinase (pdb id 1IEP4). The phosphate-positioning loop or P-loop (blue) as well as salt bridges between the activation loop or A-loop (green) and bf αC helix (orange) cover the binding tunnel at the front. The DFG motif is shown with sticks. Salt bridges involve Asp381 in the DFG motif, Arg386 in the A-loop, Glu286 in the αC helix, and Lys271. The so-called “hydrophobic pocket” is located between the αC helix and the β-sheets in the N-lobe5. Tryptophan residues used to monitor the kinetics of binding in fluorescence experiments6 are shown as sticks. The three arrows indicate the general direction in which imatinib can leave the binding site. In the following, the orange and green arrows are referred to as the long and short axis, respectively.