
Figure 6:
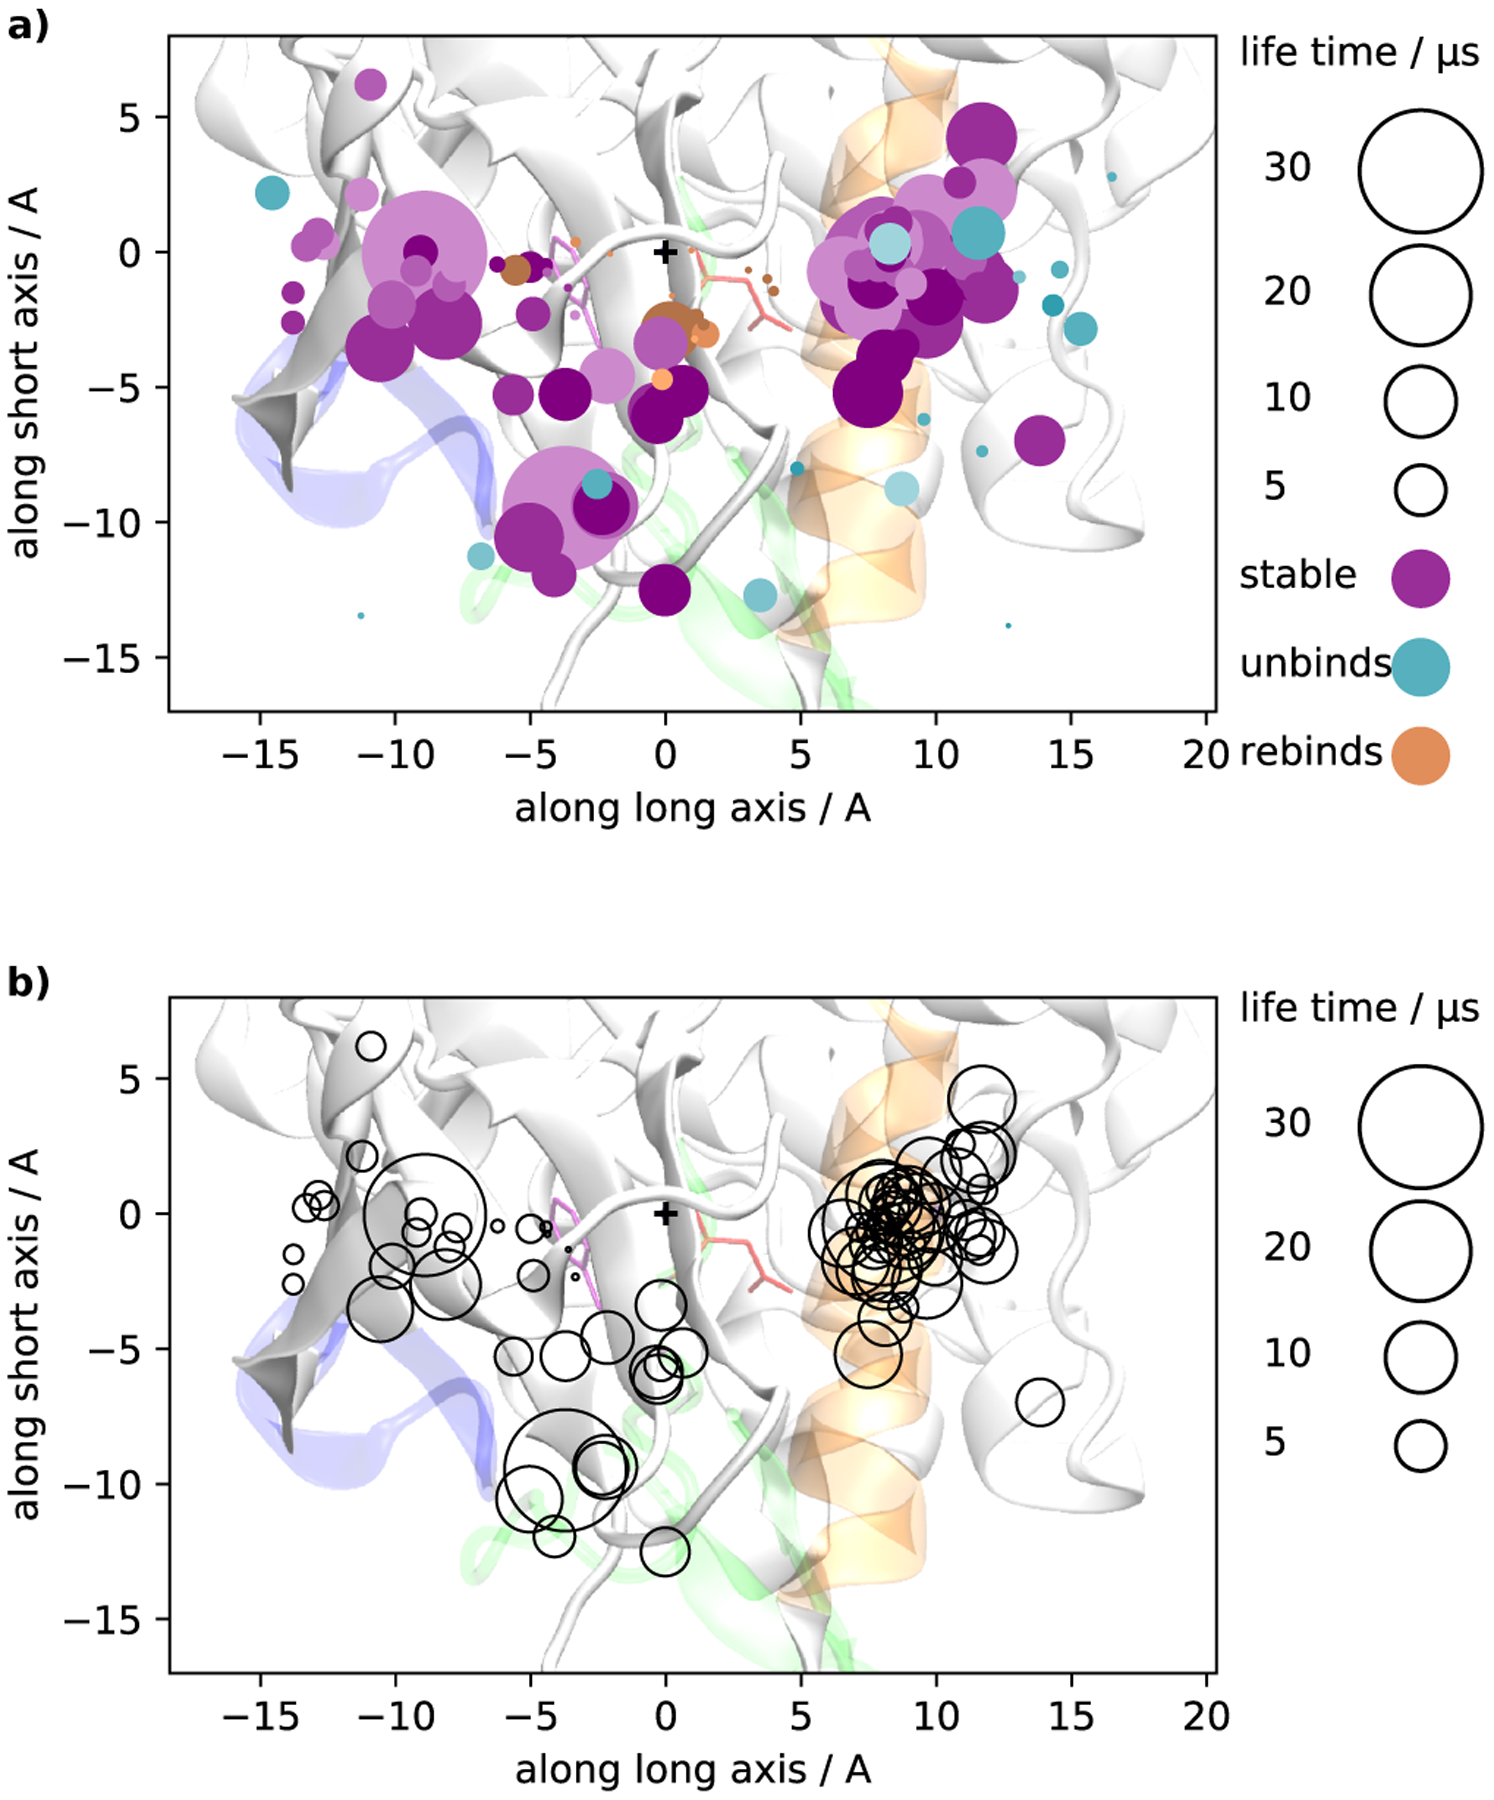
Committor-like analysis reporting the position of imatinib’s center of mass (COM) averaged over the length of each unbiased trajectory. The figure shows the projection of the COM onto a plane that separates the N and C lobes of the Abl kinase domain (same projection as in Figure 4). The plus symbol (+) marks the COM position of the crystallographic bound state. a) Colors indicate the fate of each trajectory: trajectories that reach the fully dissociated state are represented with a cyan disc. Trajectories that reach the X-ray pose are represented with orange discs. All other trajectories are shown as purple discs. Disc sizes represent the time to dissociation or rebinding to the X-ray pose for cyan and orange discs, respectively. In the trajectories that rebind to the X-ray pose, the rebinding time is very short compared to all other processes, therefore the orange discs in (a) are rendered with an area that is magnified by a factor of 10. For purple discs, size corresponds to trajectory length. b) Same as panel (a) showing only the trapped trajectories but without color.