Figure 7.
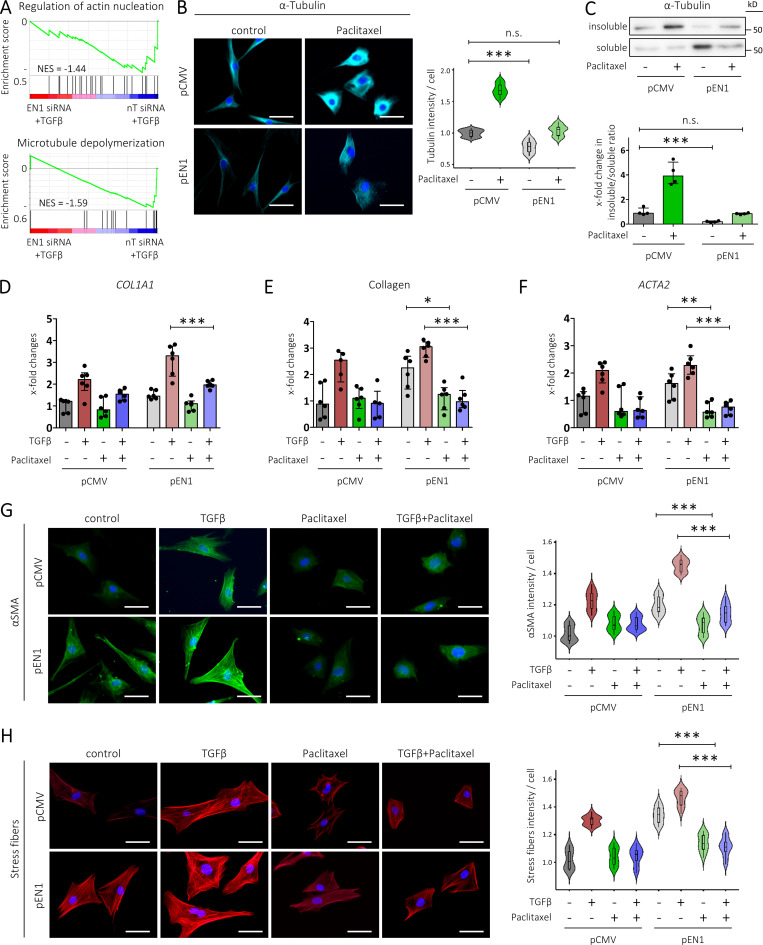
EN1 overexpression promotes microtubule depolymerization to induce myofibroblast differentiation. (A) GSEA of the indicated GO terms, showing that EN1 knockdown de-enriches genes related to microtubule depolymerization and actin nucleation. (B and C) EN1 overexpression induces microtubule depolymerization. Representative immunofluorescence stainings for α-Tubulin at 400-fold magnification (scale bars = 50 µm). Quantification of total signal intensity for each cell (relative to control) is included (B). Protein levels of soluble and insoluble α-Tubulin. Representative Western blot images and quantification of insoluble/soluble α-Tubulin ratio are included (C). Data for B and C were obtained from two independent experiments (n ≥ 4). (D–H) Pharmacological stabilization of microtubules prevents EN1-induced myofibroblast differentiation. Relative mRNA levels of COL1A1 (D). Relative protein levels of secreted collagen type I (E). Relative mRNA levels of ACTA2 (F). Representative immunofluorescence stainings for αSMA (G) and stress fibers (H) at 400-fold magnification (scale bars = 50 µm). Quantification of average signal intensity for each cell (relative to control) is included. Data for D–H were obtained from two independent experiments (n ≥ 4). All data are represented as median ± interquartile range. P values are expressed as follows: *, 0.05 > P > 0.01; **, 0.01 > P > 0.001; ***, P < 0.001 (ANOVA with Tukey’s post hoc test).

