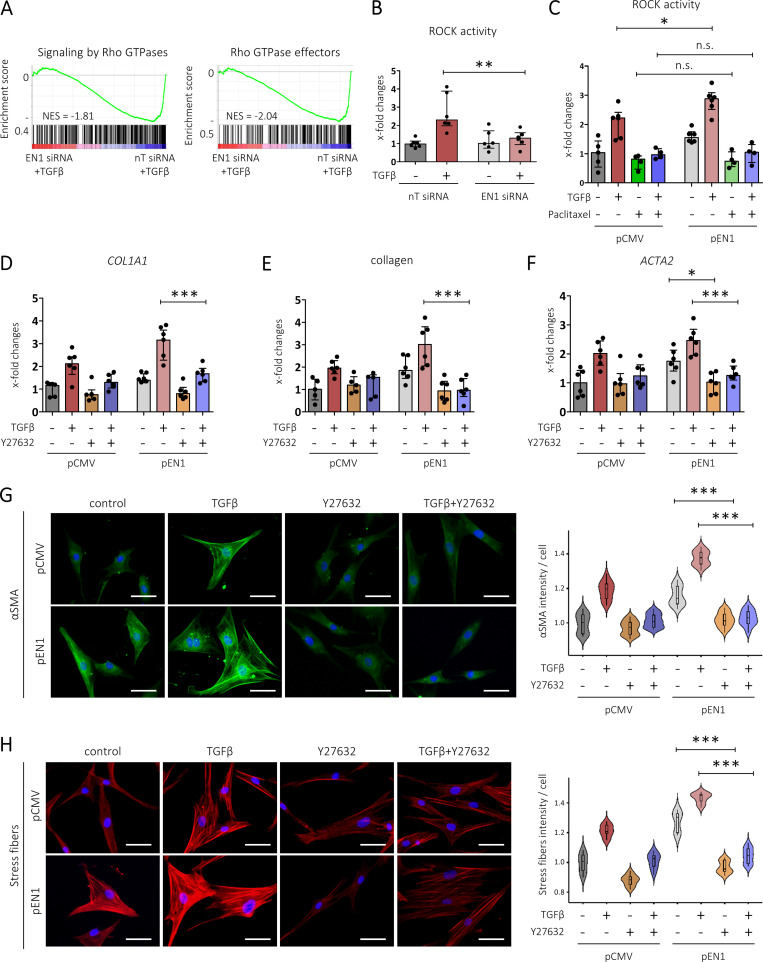
Figure 8.
EN1 induces ROCK activity to coordinate microtubule-actin cytoskeletal rearrangements and myofibroblast differentiation.(A) GSEA of the indicated Reactome terms, showing that EN1 knockdown de-enriches genes related to signaling by Rho GTPases and Rho GTPases effectors. (B and C) EN1 induces ROCK activity by depolymerizing microtubules. ROCK activity after EN1 knockdown (B). ROCK activity after EN1 overexpression with/without microtubule stabilization (C). Data for B and C were obtained from two independent experiments (n ≥ 4). (D–H) Pharmacological inhibition of ROCK activity prevents EN1-induced myofibroblast differentiation. Relative mRNA levels of COL1A1 (D). Relative protein levels of secreted collagen type I (E). Relative mRNA levels of ACTA2 (F). Representative immunofluorescence stainings for αSMA (G) and stress fibers (H) at 400-fold magnification (scale bars = 50 µm). Quantification of average signal intensity for each cell (relative to control) is included. Data for D–H were obtained from two independent experiments (n ≥ 4). All data are represented as median ± interquartile range. P values are expressed as follows: *, 0.05 > P > 0.01; **, 0.01 > P > 0.001; ***, P < 0.001 (ANOVA with Tukey’s post hoc test).

