
Figure 3. Functional roles of the LTB4-BLT1 axis in diverse cell migration scenarios.
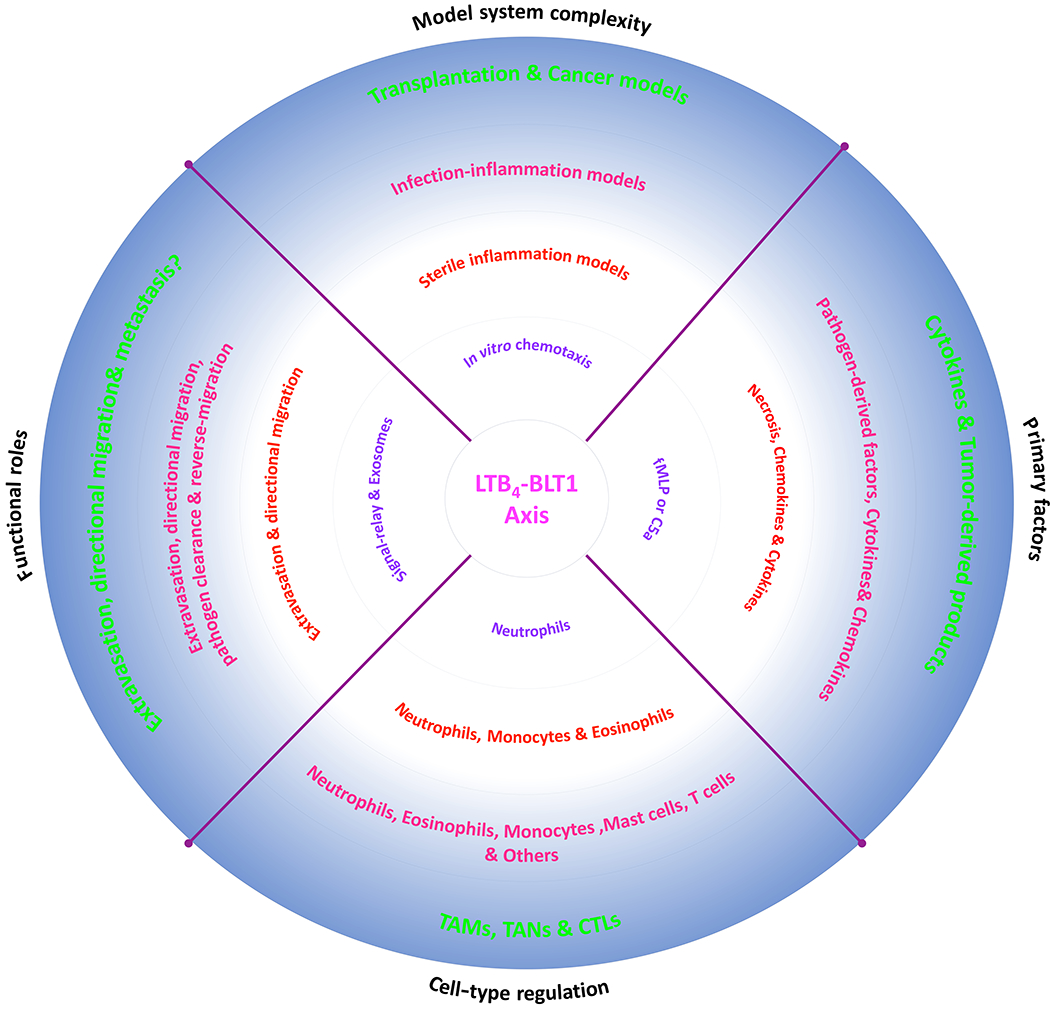
A pie chart depicting the diverse roles of the LTB4-BLT1 axis in distinct situations that involve increased complexities, factors and cell-types.
Official websites use .gov
A
.gov website belongs to an official
government organization in the United States.
Secure .gov websites use HTTPS
A lock (
) or https:// means you've safely
connected to the .gov website. Share sensitive
information only on official, secure websites.
A pie chart depicting the diverse roles of the LTB4-BLT1 axis in distinct situations that involve increased complexities, factors and cell-types.