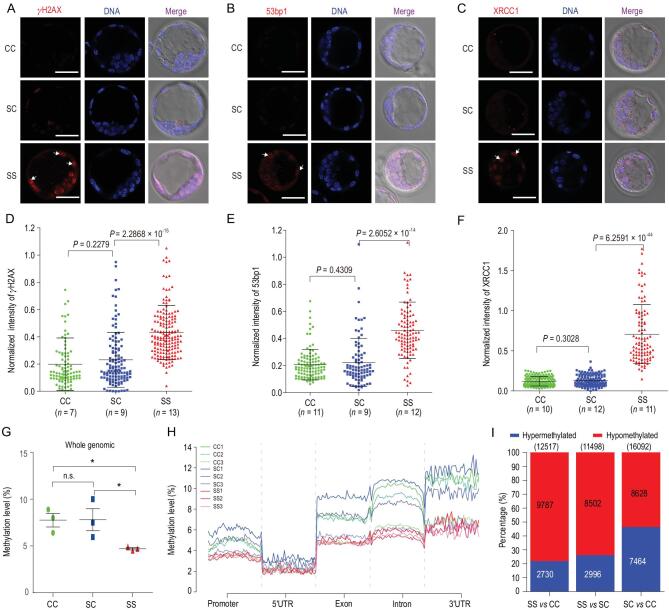
Figure 3.
DNA damage and DNA methylome alterations in mouse embryos in space. (A–C) Representative images of CC, SC and SS blastocysts stained with γH2AX, 53bp1 and XRCC1 antibodies, respectively. Distinct staining patterns of cells were observed in blastocysts developed in space (white arrowheads). Scale bars, 50 μm. (D–F) Quantification of γH2AX (D), 53bp1 (E) and XRCC1 (F) immunofluorescence intensity normalized to DNA staining by Hoechst and analysed with ImageJ software. One imaging section was selected for each embryo for quantification, and the pooled data from embryos were plotted in the graphs. n = number of embryos. The results are shown as the means ± SEM. P values are from two-tailed unpaired Student's t-test. (G) The levels of genome-wide DNA methylation in CC, SC and SS blastocysts are shown. Three blastocysts were used for each group. The result are shown as the means ± SEM. Asterisks indicate the significance level of P < 0.05 (t-test). (H) Distribution of DNA methylation in the CpG context among various genomic element regions, including promoters, 5'UTR, exons, introns and 3'UTRs in CC, SC and SS blastocysts. The numbers denote the ID of specific blastocysts. (I) The number of differentially methylated regions (DMRs) in each pair-wise comparison of groups are shown. Blue and red bars indicate the proportion of hypermethylated and hypomethylated DMRs.

