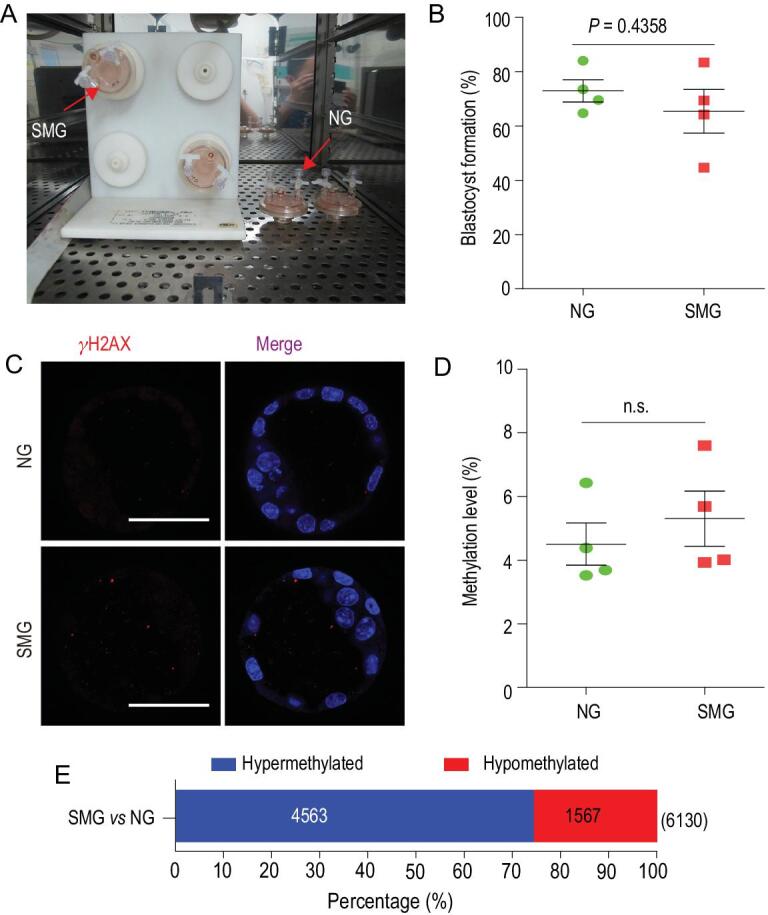
Figure 5.

Effects of simulated microgravity on preimplantation embryonic development. (A) An image of the experimental apparatus, in which the embryos were inoculated into 10 mL of the culture vessel of RCCS for the simulated microgravity culture and static culture in CO2 incubators. (B) The rates of development of embryos to the blastocyst stages under normal gravity (NG) and simulated microgravity (SMG) conditions. Data are presented as the means ± SEM from four independent experiments (embryos analysed: n = 899 for NG; n = 886 for SMG). (C) Representative fluorescence images of γH2AX in blastocysts that were developed from 2-cell embryos exposed to NG and SMG conditions for 64 h. Scale bars, 50 μm. (D) The levels of genome-wide DNA methylation in NG and SMG blastocysts are shown. Data are presented as the means ± SEM from four blastocysts. (E) The number of differentially methylated regions (DMRs) between SMG and NG group are shown. Blue and red bars indicate the proportion of hypermethylated and hypomethylated DMRs. Throughout, a Student's t-test (two-tailed) was used for statistical analysis; n.s., not significant.
