. 2021 Jun 8;116(6):1127–1136. [Article in Portuguese] doi: 10.36660/abc.20190397

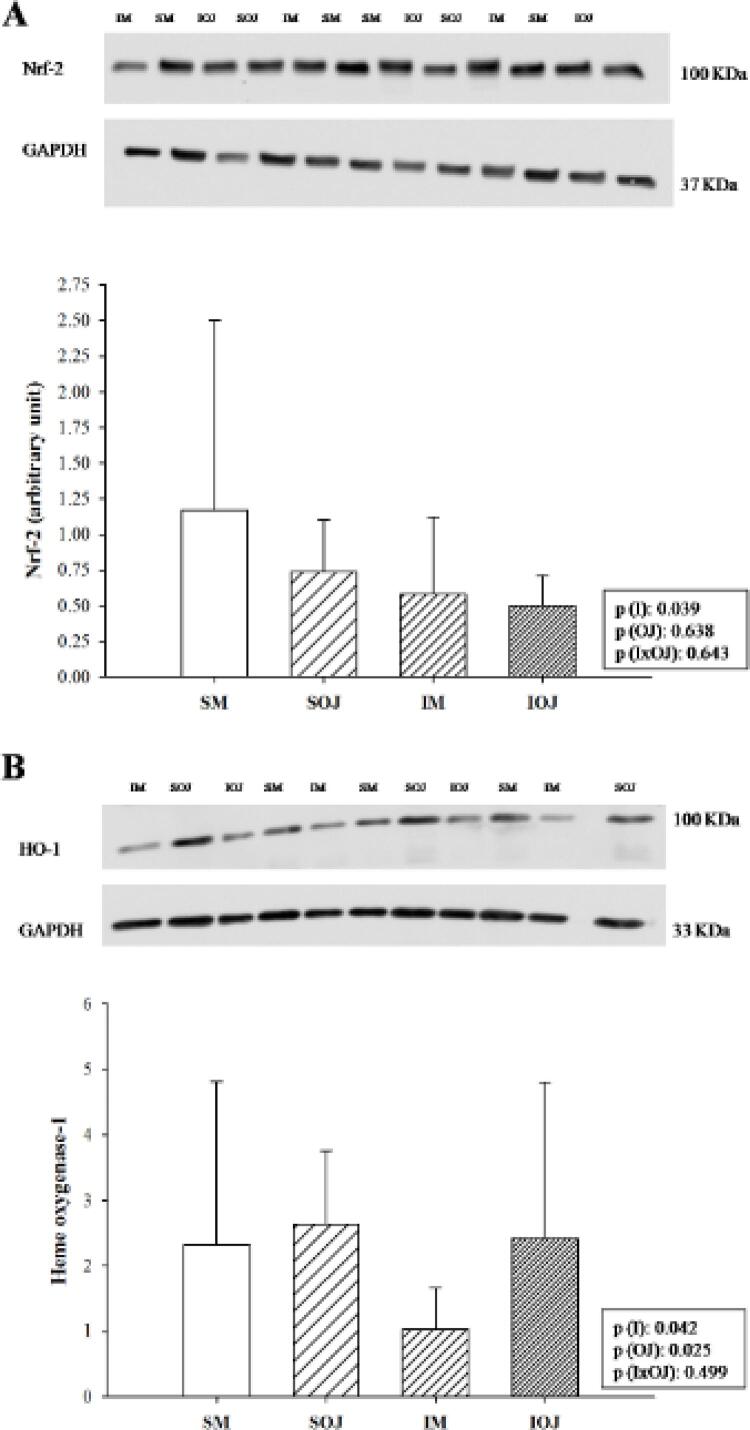
Figure 1. – Nuclear factor erythroid 2-related factor 2 (Nrf2) and heme-oxygenase-1 (HO-1) expression in sham and infarcted rats by Western blot. Bar chart showing the expression of Nrf2 and HO-1 proteins in each group (A) Nrf2 expression and representative Western blot; sample size: 8 in each group. (B) HO-1 expression and representative Western blot; sample size: SM = 5; SOJ = 6; IM = 5; IOJ = 5. GAPDH glyceraldehyde-3-phosphate dehydrogenase. Data are expressed as mean ± SD. p(I): p value between non-infarcted animals vs. infarcted animals; p(OJ): p value between animals that received maltodextrin vs. animals that received orange juice; p(IxOJ): p-value for the interaction between the factors of infarction and orange juice intake.

Figure 1