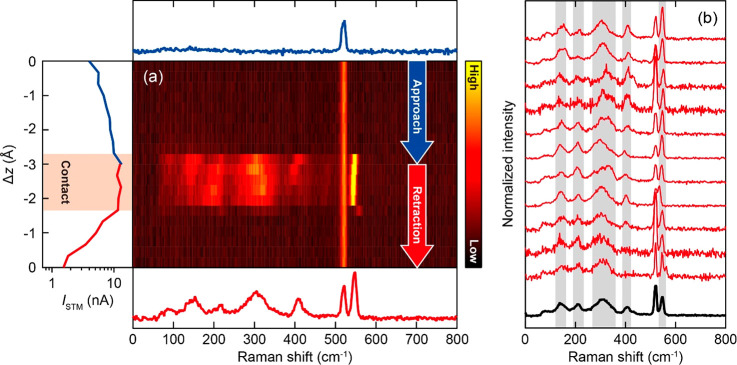
Figure 2.
(a) Water fall plot of TERS recorded during tip-approach and retraction over Si(111)-7 × 7 (10 K, Vbias = 0 V, λext = 633 nm, Pext = 0.7 mW/μm2). The left panel shows the simultaneously recorded ISTM–Δz curve. Although the Vbias is nominally set to zero, the current occurs due to the photovoltage under illumination. The red shaded region indicates the APC. The top and bottom panels display the TERS spectra in the tunneling and contact regimes, respectively. (b) TERS spectra obtained for 11 different APCs (red) recorded for different location (UHUCs) and different tip conditions. The black one shows the averaged spectrum. The spectra are normalized to its area from range of Raman shift 0–500 cm–1.

