Figure 3.
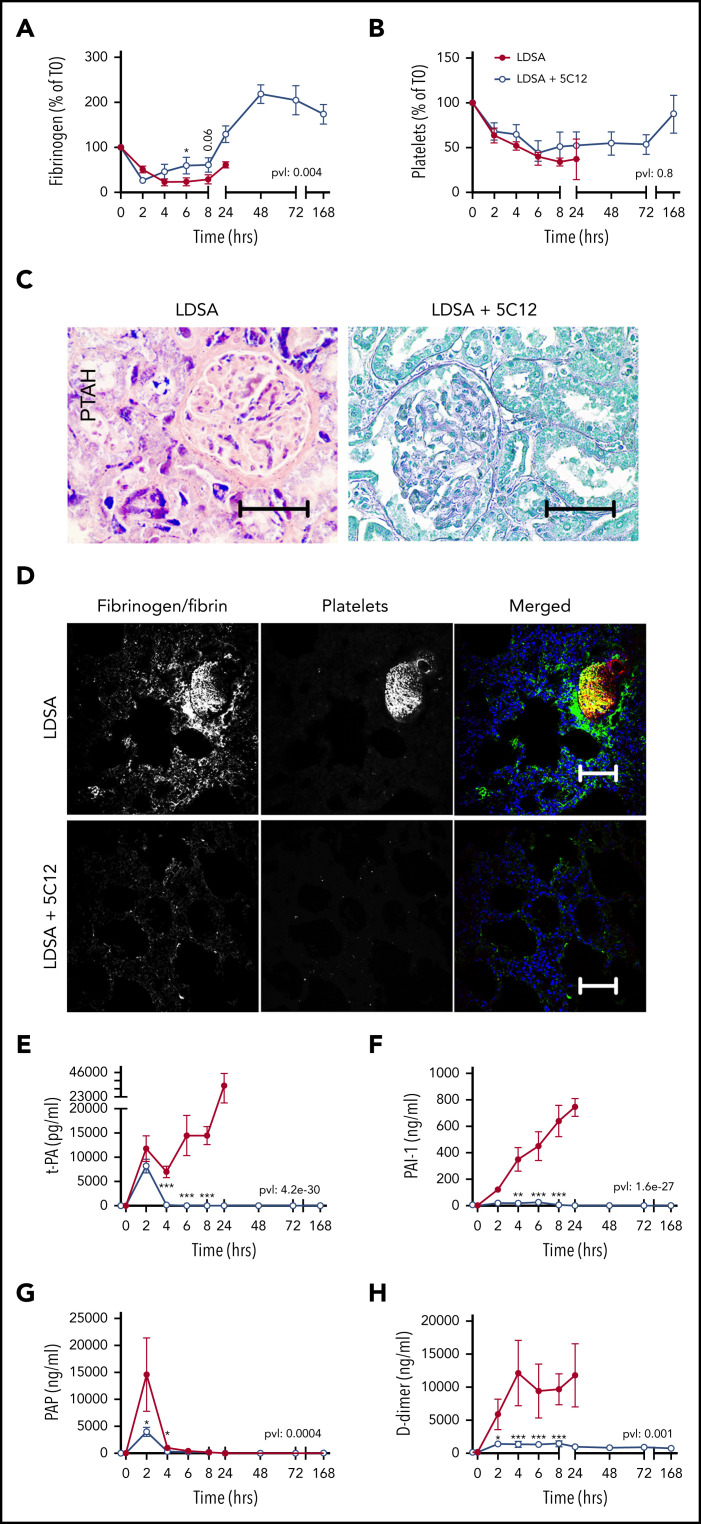
Effect of 5C12 anti-FXII antibody on fibrinogen and platelet consumption, fibrin deposition in the tissues, and activation of fibrinolysis after challenge with a lethal dose of HI-SA (LDSA). (A-B) Time course dynamics of plasma fibrinogen (A) and platelet numbers (B). (C) Phosphotungstic acid–hematoxylin (PTAH) staining of kidney sections of animals challenged with LDSA, not treated (left) or treated with the 5C12 antibody (right). (D) Immunofluorescence staining for fibrin/fibrinogen (left) and platelet marker CD41 (middle) in the lung of baboons challenged with LDSA that were either not treated (top) or treated with the 5C12 antibody (bottom); merged color images are shown in the right panels. Nuclei were stained with To-PRO-3 (blue). Scale bars, 100 µm. Confocal images were acquired by using a Nikon Eclipse TE2000-U microscope equipped with a Nikon C1 scanning head; the Nikon EZ-C1 software (version 3.80) was used for image acquisition. (E-H) Time course changes of fibrinolysis markers in the plasma: t-PA (E), PAI-1 (F), plasmin-antiplasmin (PAP) complexes (G), and D-dimer (H). Same time points are compared between the treated and untreated baboons by using the generalized least squares (gls) function. *P < .05; ***P < .001. The overall P value (pvl) describing the difference between the 2 curves is shown on each graph. P < .05 is considered significant.

