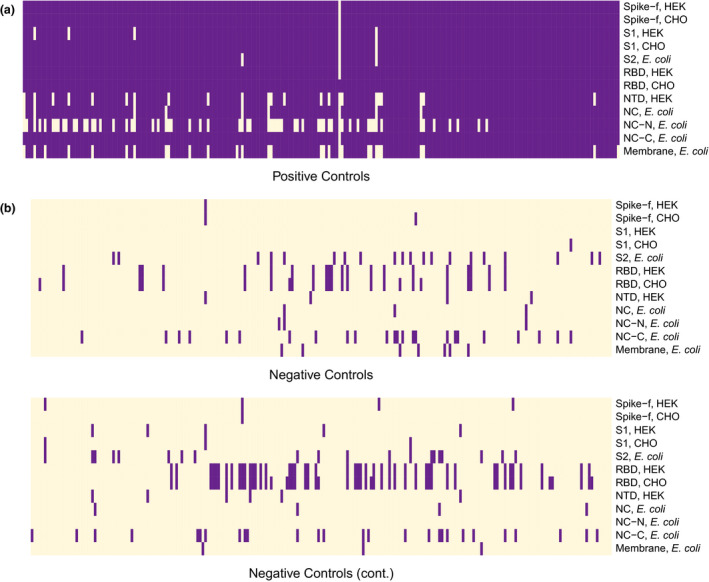
Figure 3.

Antibody profiles presented as binary data over the 12 selected antigens in positive (a) (n = 227) and negative (b) (n = 442) controls. The negative controls are divided into two panels with 221 samples each. Purple cells represent signals above the cut‐off for antibody reactivity, based on the mean + 6 × SD of the 12 negative reference samples included in each analysis.
