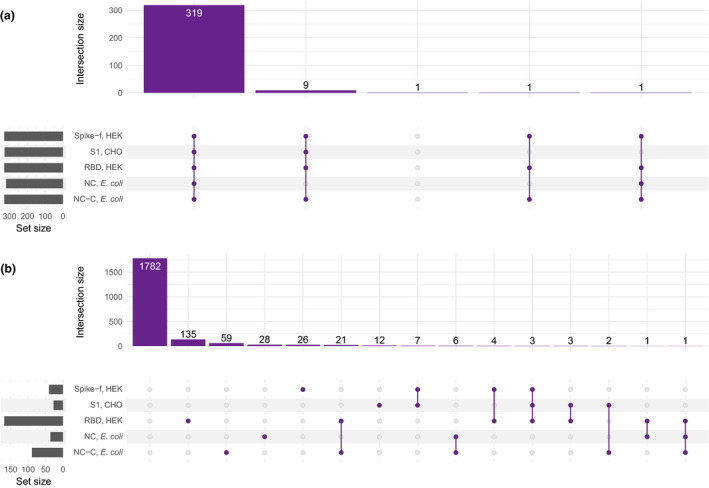
Figure 4.

Summary of the antibody profiles in positive and negative controls. The plot indicates the frequency of antibody reactivity towards one or different combinations of viral antigens in (a) positive controls (n = 331) and (b) negative controls (n = 2090).
