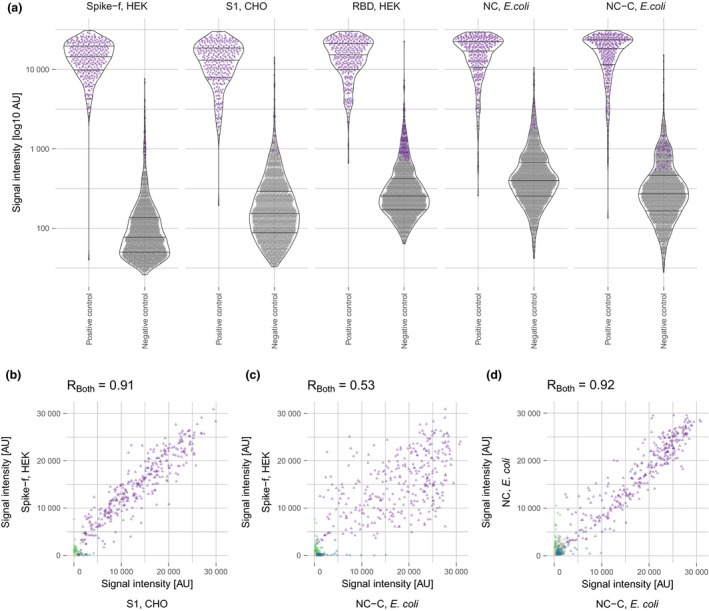
Figure 5.

(a) Antibody levels for the five best‐performing antigens in positive (n = 331) and negative (n = 2090) controls. Purple dots represent signals classified as positive. Antibody correlation using 331 positive (triangles) and 290 negative (dots) control samples for (b) Spike‐f and S1, (c) Spike‐f and NC‐C, and (d) NC and NC‐C. (b –d): purple, seropositive against both antigens, used for calculating the Pearson correlation coefficient; green, seropositive against Spike‐f; blue, seropositive against S1/NC‐C; grey, seronegative.
