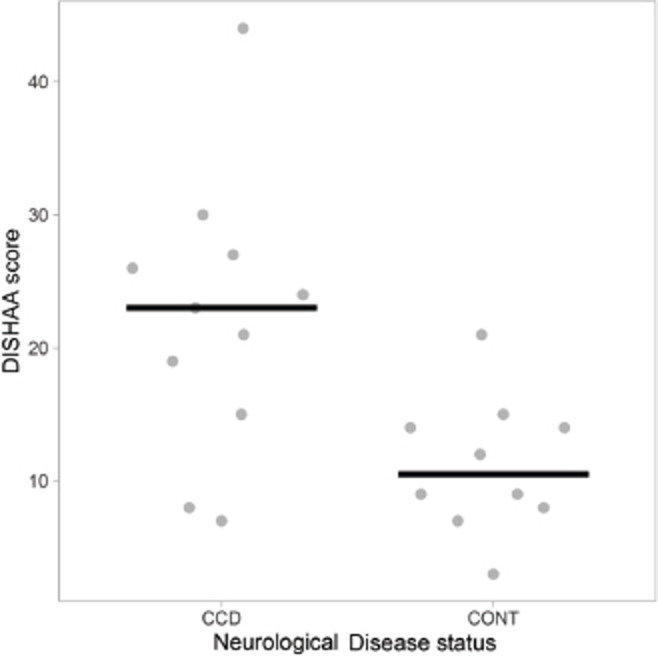
Fig. 3. Scatterplots with medians (bars) comparing DISHAA scores in CCD and control dogs. DISHAA scores (y axis) are plotted against CCD dogs and control dogs (x axis). CCD = canine cognitive dysfunction; DISHAA = Disorientation; Interactions-social; Sleep/wake cycle; House soiling, learning and memory; Activity; and Anxiety.

