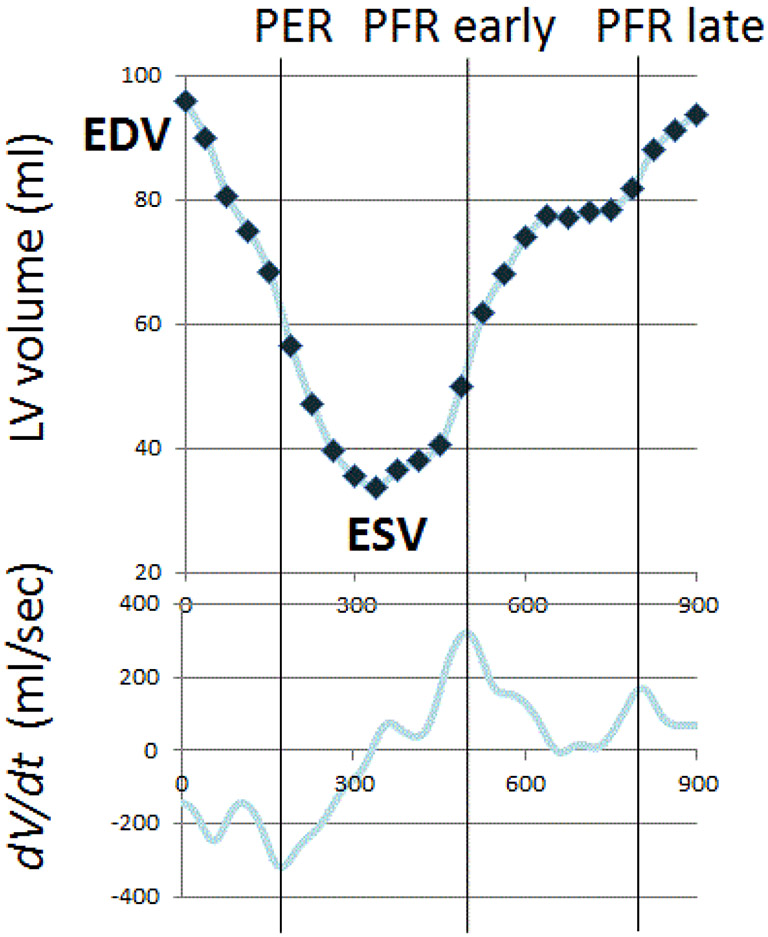
Figure 1: Time-Volume Curve.
The LV time-volume curve and its first derivative were used to determine the peak filling rate and the time to peak filling rate from end systole. LV=left ventricular, dV/dt= filling rate curve, EDV= end-diastolic volume, ESV=end-systolic volume, PER=peak ejection rate, PFR=peak filling rate

