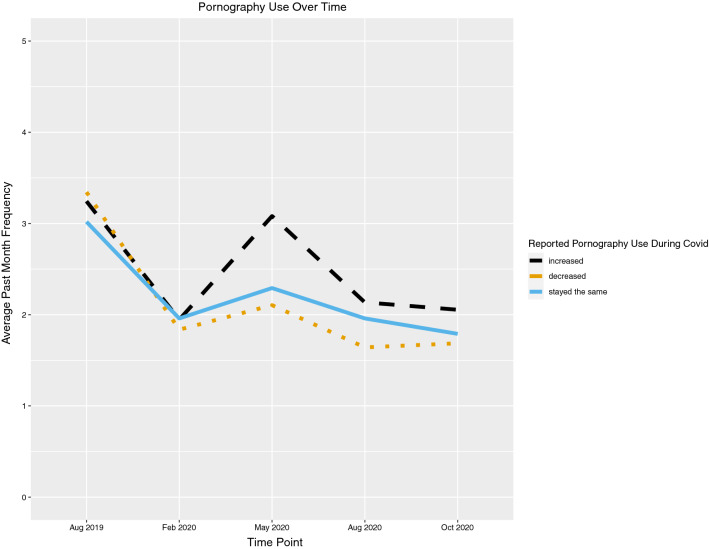
Fig. 1.
Analysis of frequency of pornography use over time among those who reported increased, decreased, or consistent use during COVID-19. Y-axis values should be interpreted as follows: 0 = not within the past month, 1 = within the past month, 2 = two or three times a month, 3 = once a week, 4 = a few times a week, and 5 = once a day or more

