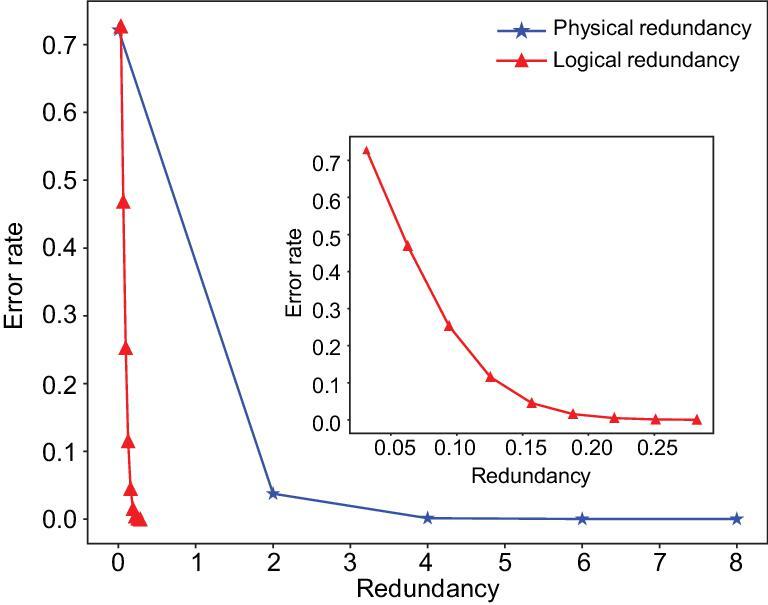
Figure 5.

The error correction capacity of coding systems with different levels of physical and logical redundancies. The ‘error rate’ on the y-axis refers to the probability of not being able to correct all the errors. Blue line: the effect of physical redundancy on error correction capacity (taking 128-bp DNA as an example). Red line: the effect of logical redundancy on error correction capacity. Here, an original BCH code with code length n = 255 is used as an example. Inset: magnified view of logical redundancy.
