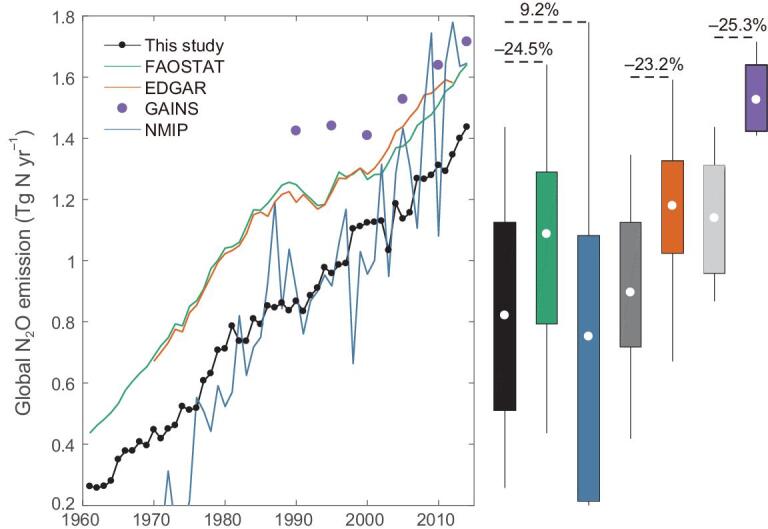
Figure 3.

Estimates of global cropland-N2O emissions in 1961-2014. We normalize the FAOSTAT and GAINS by removing the contribution from synthetic fertilizers applied to pasture, the EDGAR version 4.3.2 by excluding the contributions from synthetic fertilizers applied to pasture and soil mineralization and the NMIP by excluding the contribution from ‘background’ emissions. The box plots (mean, one standard deviation and minimum-to-maximum range) are given for the period 1961-2014 for prominent datasets (colors) and for our estimates in different periods (1961-2014: black, 1970-2012: gray, 1990-2015 in 5-yr increments: light gray). The proportion value indicates the emission difference in means between our estimates and prominent datasets, computed as the difference divided by the estimates of prominent datasets.
