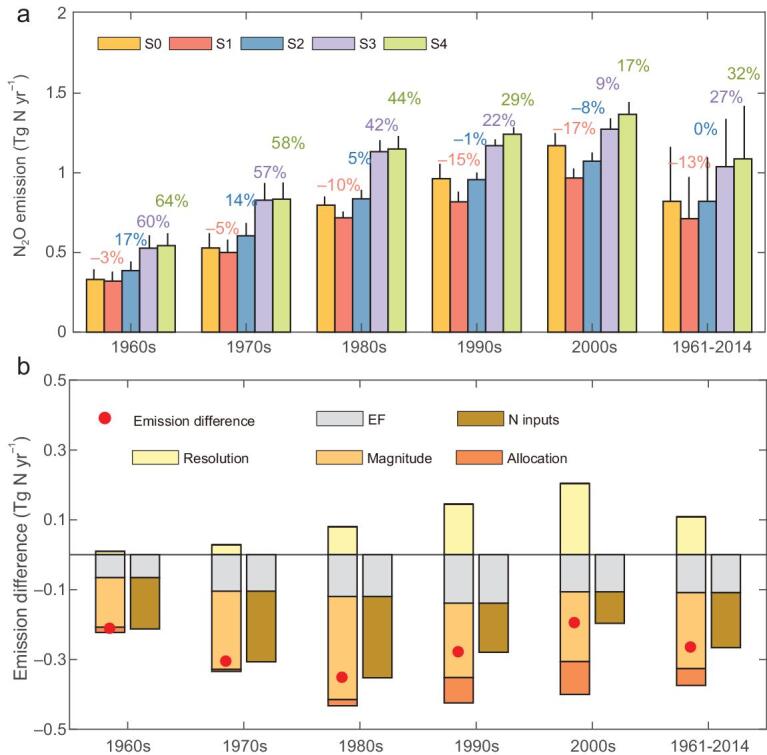
Figure 4.

Results of scenario simulations and the attribution of emission differences globally. (a) Global cropland-N2O emissions of five simulations for different periods; the difference ratio is calculated as the difference between S0 and other simulations divided by S0; the scenarios S0-S4 are defined in Methods. (b) Difference between S0 and S4 due to the effects of different EFs and N inputs, i.e. the more detailed the spatial resolution of the N inputs (S0-S1), the lower the EFs (S1-S2), the lower the N inputs for croplands (S2-S3) and the revised allocation of N inputs by crop (S3-S4). The combined effects of the N inputs and the emission difference between S0 and S4 are colored as dark yellow and red in (b), respectively.
