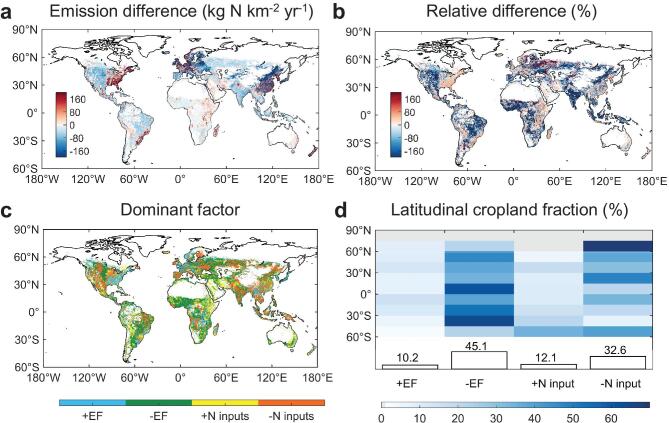
Figure 5.
Spatial patterns of dominant drivers of the difference in cropland-N2O emissions. (a) Spatial distribution of the emission difference between S0 and S4 over the period 1961–2014. (b) Relative difference computed as the emission difference divided by S0. (c) Dominant factor of emission difference, defined as the driving factor that contributes the most to the difference in cropland-N2O emissions in each cropland grid cell. The driving factors include the updated EFs and the improved N inputs. A prefix ‘+’ of the driving factors indicates a positive effect on the emission difference, whereas ‘−’ indicates a negative effect. (d) Fractional area of croplands in latitude bands (90°N-60°S) attributed to different factors. The fraction of the cropland area (%) that is dominantly driven by each factor is labeled on top of the bar; ‘+’ and ‘−’ have the same meaning as in (c).

