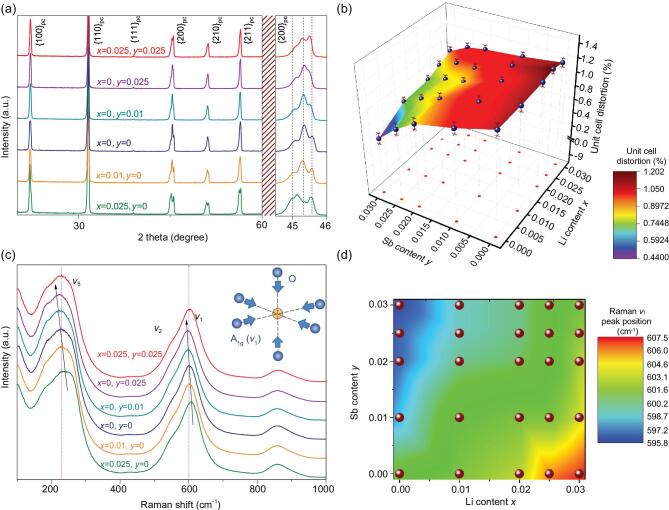
Figure 1.
(a) XRD patterns for representative LxKNNSy-5BZ-2BNZ-1Mn samples. (b) Unit cell distortion (calculated by (c/a – 1) × 100%) of the global lattice for LxKNNSy-5BZ-2BNZ-1Mn samples. (c) Room-temperature Raman spectra of representative LxKNNSy-5BZ-2BNH-1Mn samples. The inset shows a schematic illustration of the breath-type stretching A1g mode. (d) Raman v1 peak position of the LxKNNSy-5BZ-2BNH-1Mn samples.

