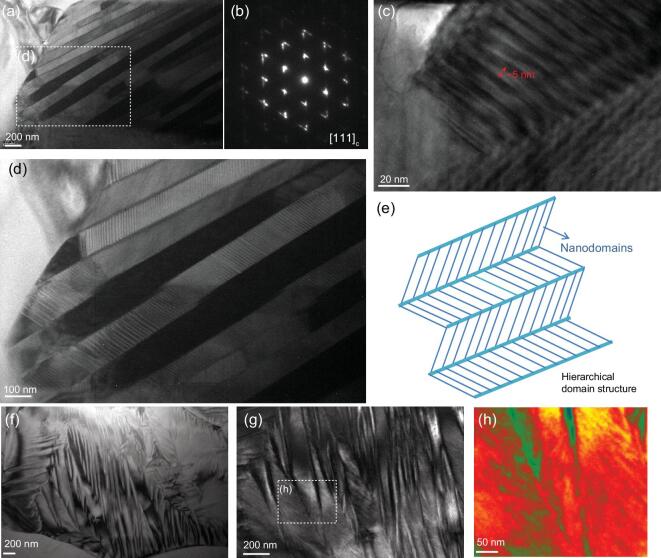
Figure 4.
(a, c, d) Bright-field TEM images of the x = 0.025, y = 0.025 sample, showing hierarchical domain configuration and the corresponding selected area electron diffraction (SAED) pattern (b). (e) Schematic diagram of the hierarchical nanodomain architecture. (f–h) Bright-field TEM images of the x = 0.025, y = 0.025 sample showing strip-like and fibrous nanodomain patterns.

