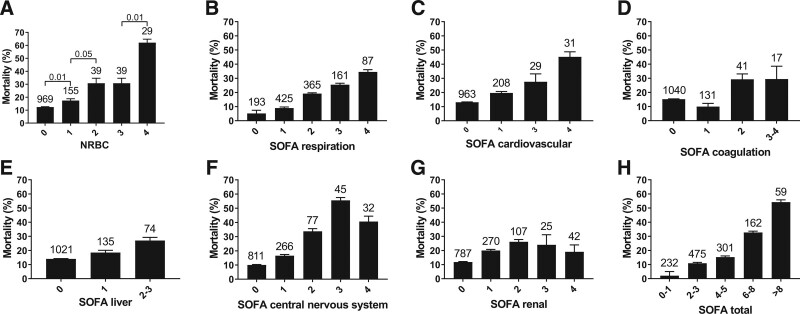
Figure 3.
A, Mean mortality grouped according to Nucleated RBC (NRBC) score. NRBC score 0 = 0.00 × 10⁹/L, 1 = 0.01 × 10⁹/L, 2 = 0.02 × 10⁹/L, 3 = 0.03–0.07 × 10⁹/L, 4 = greater than 0.07 × 10⁹/L. B–G, Components of the Sequential Organ Failure Assessment (SOFA) score. H, Total SOFA score. Error bars represent 95% CIs for the percentage. Numbers above the bars show the number of patients in each group. Groups that contained less than 10 patients were classified together with a neighboring score category.

