
Figure 5.
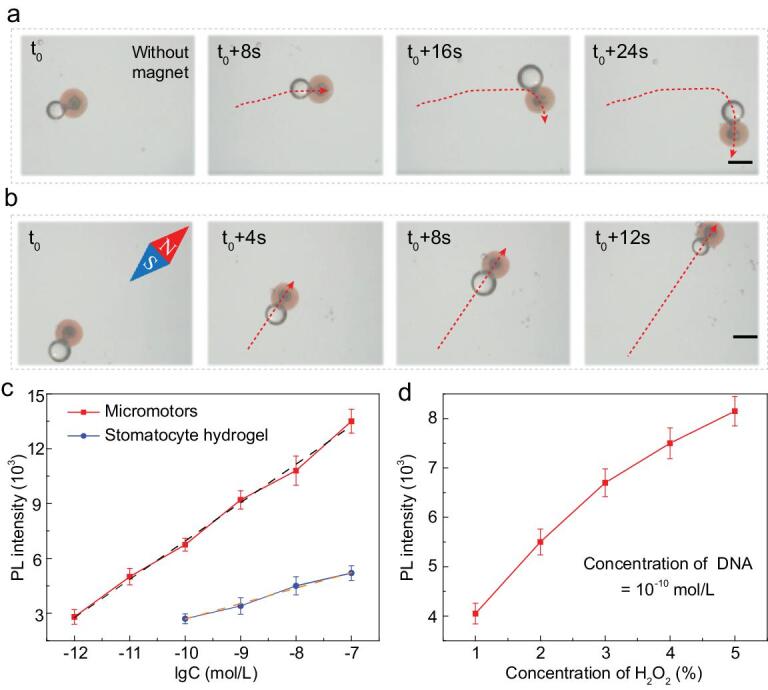
The motion performance of the barcode micromotors and their application in detecting DNA. (a) The time-lapse sequence of the motion route of micromotors without magnet guidance. The scale bar is 250 μm. (b) The time-lapse sequence of the movement of micromotors under magnet guidance. The scale bar is 250 μm. (c) Statistical analysis of the fluorescence intensity at different DNA concentrations (10−12 to 10−7 mol/L). (d) Statistical analysis of the fluorescence intensity at different H2O2 concentrations when detecting DNA with a concentration of 10−10 mol/L.