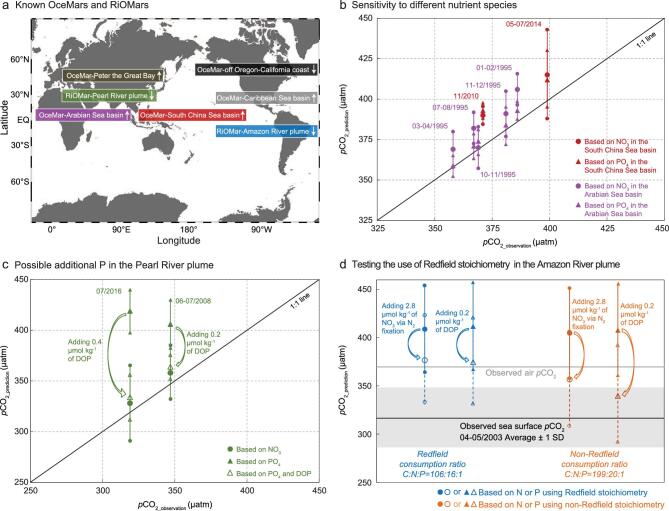
Figure 3.
Utilities and uncertainties of our semi-analytical diagnostic framework in OceMar and RiOMar regimes. (a) Known OceMars and RiOMars, with upward and downward arrows indicating sources and sinks of atmospheric CO2, respectively. (b) Comparison between predicted pCO2 based on different nutrient species and observed pCO2 in the South China Sea basin (red, two seasons) and the Arabian Sea basin (pink, five seasons). The diagonal line indicates a perfect fit between the diagnosed and observed values, and vertical bars represent one standard deviation (1 SD) of the diagnosed pCO2 values, which are largely due to the spatial variability of the observations. The consistency between CO2 source or sink diagnoses based on NO3 or PO4 demonstrates insensitivity to the choice of nutrient species. (c) As in (b), but for the Pearl River plume (green, two seasons); in both seasons, our framework identifies an addition of P that is not accounted for by our observations but needs to be considered to bring the predicted pCO2 to that based on NO3. The added P is likely transformed from dissolved organic phosphorus (DOP). (d) As in (b), but for the Amazon River plume (blue, one season), which our framework diagnoses as a source, opposite to the observed sink. Under the Redfield stoichiometry, even with unaccounted-for N or P added, our framework still predicts a sea surface pCO2 (blue) higher than the observed air pCO2 (grey line) but, under a non-Redfield stoichiometry, the same added nutrients lead to a predicted pCO2 (orange) that is close to or within the uncertainty range due to spatial variability (grey shadow) of the observed average sea surface pCO2 (black line).

