
Figure 4.
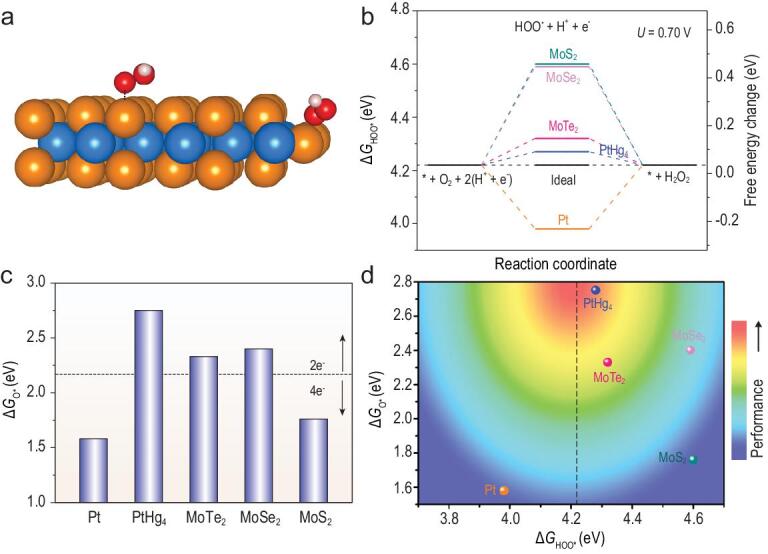
DFT simulations of the 2e-ORR pathway on 2H MoTe2. (a) Optimized structure of HOO* adsorbed on the basal plane or edge site; blue, orange, red and white spheres represent Mo, Te, O and H atoms, respectively. (b) ΔGHOO* for 2e-ORR to H2O2 on Pt [11], PtHg4 [11], MoTe2, MoSe2 and MoS2 at the equilibrium potential of UO2/H2O2 = 0.70 V and the corresponding free-energy profiles. (c) ΔGO* of Pt [11], PtHg4 [11], MoTe2, MoSe2 and MoS2; the position of the dashed line (2.17 eV) denotes the average value of ΔGO* on Pt (typical 4e-ORR electrocatalyst) and PtHg4 (typical 2e-ORR electrocatalyst), which was proposed to be the boundary between 4e and 2e selectivity. (d) 2D ‘heat map’ for 2e-ORR performance (both activity and selectivity); the dashed line represents the optimal ΔGHOO* for H2O2 production.