Figure 2.

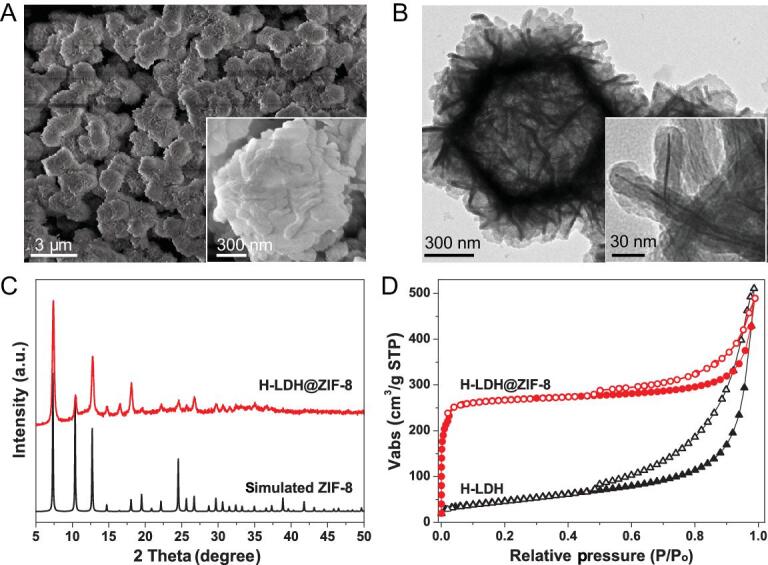
SEM and TEM images, powder XRD patterns, and N2 sorption isotherms. (A) SEM and (B) TEM images of H-LDH@ZIF-8 (inset: enlarged images). (C) Powder XRD patterns and (D) N2 sorption isotherms at 77 K.

SEM and TEM images, powder XRD patterns, and N2 sorption isotherms. (A) SEM and (B) TEM images of H-LDH@ZIF-8 (inset: enlarged images). (C) Powder XRD patterns and (D) N2 sorption isotherms at 77 K.