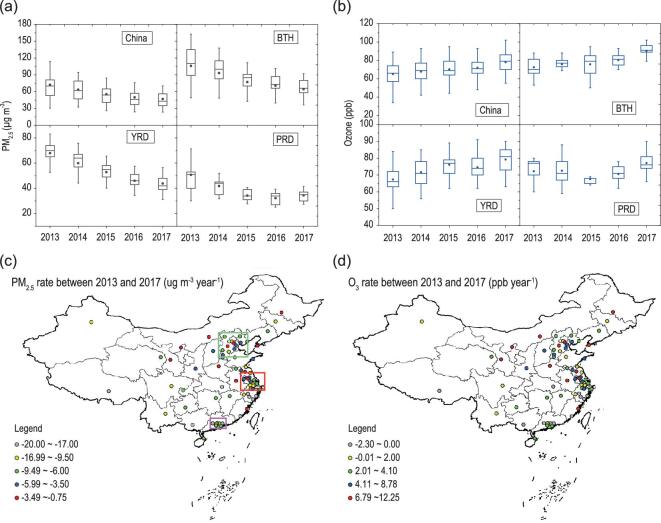
Figure 1.
(a) Annual mass concentration of PM2.5 in China, Jing-Jin-Ji (BTH), Yangtze River Delta (YRD) and Pearl River Delta (PRD) from 2013 to 2017. The mass concentrations of PM2.5 were calculated from 74 key cities in China. The upper and lower boundaries of the boxes represent the 75th and 25th percentiles; the line within the box represents the median value; the whiskers above and below the boxes represent the 90th and 10th percentiles; the points within the box represent the mean value. (b) Annual mixing ratio of ozone in China, BTH, YRD and PRD from 2013 to 2017. (c) Variation ratio of PM2.5 concentration in 2017 compared with that in 2013. The BTH region, YRD region and PRD region are marked by green, red and purple squares, respectively. (d) Variation ratio of ozone concentration in 2017 compared with that in 2013.

