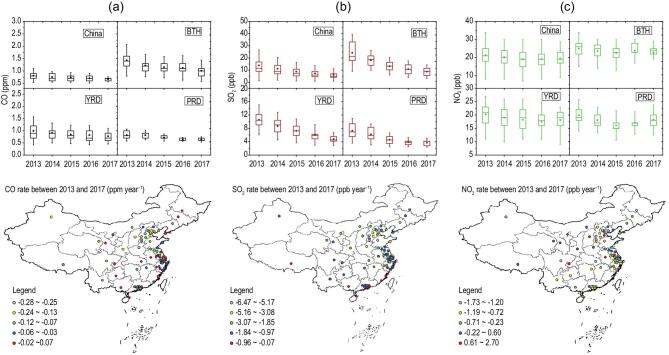
Figure 2.
Annual mixing ratio and variation of CO (a), SO2 (b) and NO2 (c) in China, BTH, YRD and PRD from 2013 to 2017. The mixing ratios were calculated from 74 key cities in China. The upper and lower boundaries of the boxes represent the 75th and 25th percentiles; the line within the box represents the median value; the whiskers above and below boxes represent the 90th and 10th percentiles; the points within the box represent the mean value. The differences between the mixing ratios at 74 cities in 2017 were compared with those in 2013.

