Figure 3.
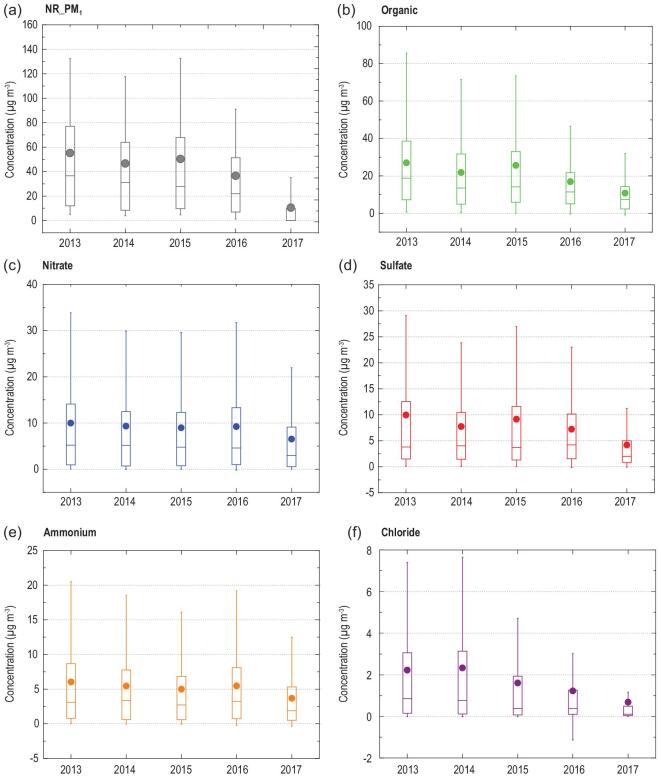
Annual mass concentrations of NR_PM1 (a), organic (b), nitrate (c), sulfate (d), ammonium (e) and chloride (f) in urban Beijing by HR-ToF-AMS from 2013 to 2017. The upper and lower boundaries of the boxes represent the 75th and 25th percentiles; the line within the box represents the median value; the whiskers above and below the boxes represent the 90th and 10th percentiles; the points within the box represent the mean value. Note that the annual mass concentrations were calculated from different periods during a year, since AMS was not always working. The period with measurement is shown in the Supplementary Data. The annual-average mass concentrations of organic, nitrate, sulfate, ammonium and chloride were 27.0 ± 26.2, 10.0 ± 12.2, 10.1 ± 14.6, 6.1 ± 7.2 and 2.2 ± 3.1 μg m−3, respectively, in 2013 and decreased to 10.8 ± 12.5, 6.5 ± 8.6, 4.2 ± 6.2, 3.7 ± 4.5 and 0.7 ± 1.4 μg m−3, respectively, in 2017.

