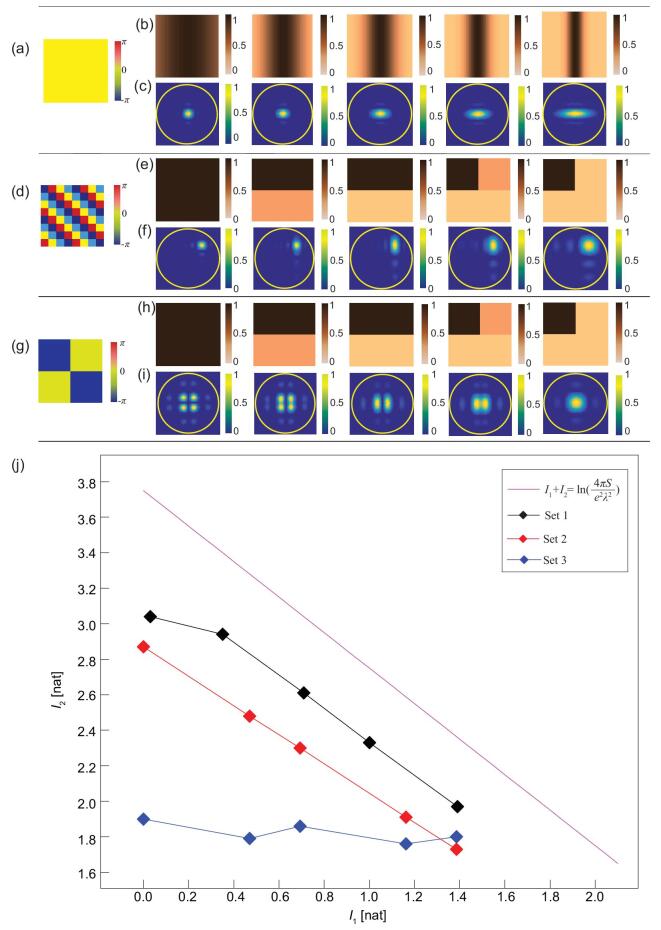
Figure 2.
Phase (a, d, g) and amplitude (b, e, h) distributions of the three sets of metasurface samples. (c, f, i) Normalized radiation patterns generated by the three sets of metasurface samples. (j) Calculated results of the information relation between the metasurface samples and their radiation patterns, and the upper bound.

