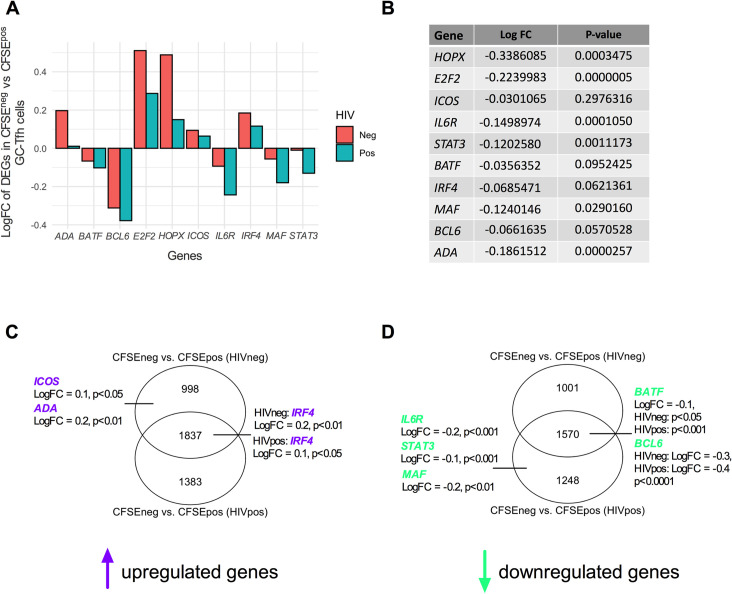
Fig 5. c-Maf signaling represents a key dysregulated pathway in proliferating HIVpos GC-Tfh cells.
(A) shows log2-fold change (logFC) in the expression of selected DEGs in different cell signaling and GC-Tfh-associated immunological pathways in proliferating (CFSEneg vs CFSEpos) HIVneg and HIVpos GC-Tfh cells. Among these, are genes coding for transcription factors (E2F2) and coregulators (HOPX), enzymes (ADA) and key GC-Tfh genes (ICOS, IRF4, BCL6, MAF and mediators of its signaling pathway IL6R, STAT3, BATF). (B) table showing log2-fold change (logFC) values and statistical significance between proliferating HIVpos versus HIVneg GC-Tfh cells for each selected DEG in (A). To assess statistical significance between the logFC of proliferating HIVpos versus HIVneg GC-Tfh cells, data in (A) was analyzed using a double contrast. CFSEneg values were baselined to CFSEpos values and an HIVpos versus HIVneg contrast was performed to compare significance between (CFSEneg vs CFSEpos) HIVpos and (CFSEneg vs CFSEpos) HIVneg cells. (C-D) Venn diagram analysis of proliferating (CFSEneg vs CFSEpos) HIVneg and HIVpos GC-Tfh cells. Diagrams show the numbers of unique and common statistically significant DEGs in the indicated GC-Tfh populations. (C) shows Venn diagram analysis of upregulated DEGs (represented in purple) and (D) shows Venn diagram analysis of downregulated DEGs (represented in green) in HIVneg and HIVpos cells. (B-D) Analysis was performed based on nominal p-value p<0.05.

